MNIST NN Visualization
by allenlu2007
再接再厲,繼續 MNIST 使用 convolution neural network classifier. 不過重點不是在準確率,而是在 visualisation.
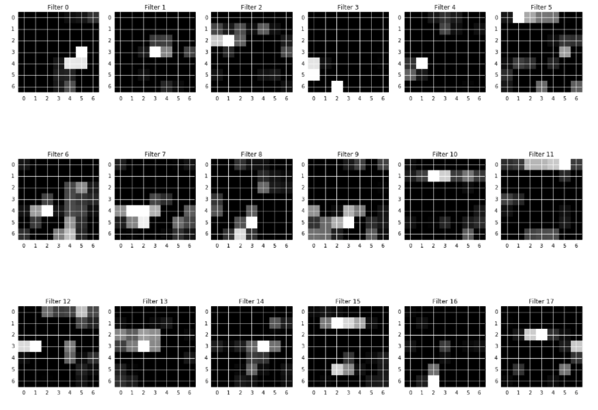
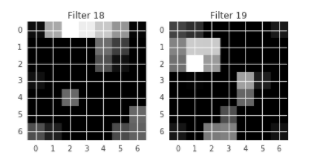
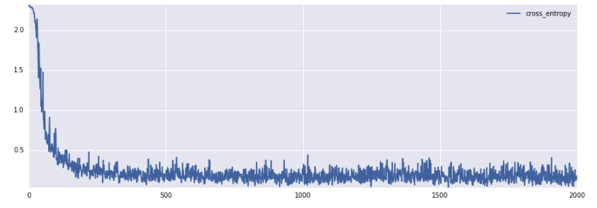
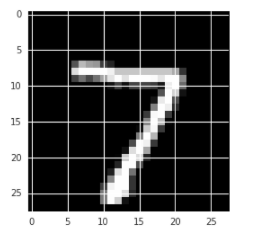
同樣三部曲:imshow(original image), plot(loss), imshow(weights),
Some catch:
SGD vs. Adam
Keep_prob ~ dropout : very important to prevent overfit in neural network!
# Visualizing Neural Network Layer
import numpy as np
import matplotlib as mp
%matplotlib inline
import matplotlib.pyplot as plt
import tensorflow as tf
import tensorflow.contrib.slim as slim
from tensorflow.examples.tutorials.mnist import input_data
import math
mnist = input_data.read_data_sets("MNIST_data/", one_hot=True)
tf.reset_default_graph()

x = tf.placeholder(tf.float32, [None, 784],name="x-in")
y_ = tf.placeholder(tf.float32, [None, 10],name="y-in")
#x = tf.placeholder(tf.float32, [None, 784])
#y_ = tf.placeholder(tf.float32, [None, 10])
keep_prob = tf.placeholder("float")

# the following is softmax
#W = tf.Variable(tf.zeros([784, 10]))
#b = tf.Variable(tf.zeros([10]))
#y = tf.nn.softmax(tf.matmul(x, W) + b)

x_image = tf.reshape(x,[-1,28,28,1])
hidden_1 = slim.conv2d(x_image,5,[5,5])
pool_1 = slim.max_pool2d(hidden_1,[2,2])
hidden_2 = slim.conv2d(pool_1,5,[5,5])
pool_2 = slim.max_pool2d(hidden_2,[2,2])
hidden_3 = slim.conv2d(pool_2,20,[5,5])
hidden_3 = slim.dropout(hidden_3,keep_prob)
y = slim.fully_connected(slim.flatten(hidden_3),10,activation_fn=tf.nn.softmax)

# cross_entropy = -tf.reduce_sum(y_*tf.log(out_y))
cross_entropy = tf.reduce_mean(-tf.reduce_sum(y_*tf.log(y), reduction_indices=[1]))
correct_prediction = tf.equal(tf.argmax(y,1), tf.argmax(y_,1))
accuracy = tf.reduce_mean(tf.cast(correct_prediction, "float"))
#train_step = tf.train.AdamOptimizer(1e-4).minimize(cross_entropy)
train_step = tf.train.GradientDescentOptimizer(0.1).minimize(cross_entropy)
sess = tf.InteractiveSession()
tf.global_variables_initializer().run()
#init = tf.global_variables_initializer()
#sess.run(init)

batchSize = 100
n_train = 2001

# for visualization
fig, ax = plt.subplots(1, 1, figsize=(15, 5))
xvalues = np.arange(n_train)
yvalues = np.zeros(n_train)
lines, = ax.plot(xvalues, yvalues, label='cross_entropy')

for i in range(n_train):
    batch_xs, batch_ys = mnist.train.next_batch(batchSize)
    sess.run(train_step, feed_dict={x:batch_xs, y_:batch_ys, keep_prob:1.0})
    #batch = mnist.train.next_batch(batchSize)
    #sess.run(train_step, feed_dict={x:batch[0], y_:batch[1], keep_prob:0.5})
    if i % 1000 == 0 and i != 0:
        trainAccuracy = sess.run(accuracy, feed_dict={x:batch_xs,y_:batch_ys, keep_prob:1.0})
        print("step %d, training accuracy %g"%(i, trainAccuracy))

    yvalues[i] = cross_entropy.eval(feed_dict={x: mnist.test.images[0:100], y_: mnist.test.labels[0:100], keep_prob:0.5})
    lines.set_data(xvalues, yvalues)
    ax.set_ylim((yvalues.min(), yvalues.max()))
    #ax.set_ylim((yvalues.min(), 0.3))
    plt.legend()
    plt.pause(.00001)
testAccuracy = sess.run(accuracy, feed_dict={x:mnist.test.images,y_:mnist.test.labels, keep_prob:1.0})
print("test accuracy %g"%(testAccuracy))
def getActivations(layer,stimuli):
    units = sess.run(layer,feed_dict={x:np.reshape(stimuli,[1,784],order='F'),keep_prob:1.0})
    plotNNFilter(units)
def plotNNFilter(units):
    filters = units.shape[3]
    plt.figure(1, figsize=(20,20))
    n_columns = 6
    n_rows = math.ceil(filters / n_columns) + 1
    for i in range(filters):
        plt.subplot(n_rows, n_columns, i+1)
        plt.title('Filter ' + str(i))
        plt.imshow(units[0,:,:,i], interpolation="nearest", cmap="gray")
imageToUse = mnist.test.images[0]
plt.imshow(np.reshape(imageToUse,[28,28]), interpolation="nearest", cmap="gray")
getActivations(hidden_1,imageToUse)

getActivations(hidden_2,imageToUse)
getActivations(hidden_3,imageToUse)


