allenlu2007

A great WordPress.com site

Month: June, 2017

TensorFlow ABC

by allenlu2007

Reference: http://www.learningtensorflow.com/

Reference: http://learningtensorflow.com/lesson4/

Reference: https://deeplearning4j.org/compare-dl4j-torch7-pylearn


最早 study computer vision (CV) 是用 OpenCV (C/C++ core and Python interface), 主要是傳統的算法為主(比較少 deep learning 的結構和算法)。OpenCV 是結果導向。對於 debug and visualization input/output/intermediate results 沒太大幫助。

再來是 Caffe/Torch/Theano/..  等各大學的 free software.  最常用的是 Caffe (Python interface).  對於 computer vision, 特別是 deep learning 的推廣有很大的作用。Caffe 的限制是只用在 computer vision or machine vision 應用。不適合用在 text, sound, time series 的應用 (e.g. reinforce learning?)  Caffe2 improve this?

Why TensorFlow?

再來是 Google 提供的 TensorFlow (Python API over C/C++ engine), 繼承 Theano 的優點的下一代 (Theano creator 加入 Google).   雖然 TensorFlow 和 Caffe or Theano 能做的事差別不大 (Alexnet/Googlenet/… etc.).  但 Google TensorFlow 至少有兩大優點 (1) 提供 visualization tool (Tensor Board) 對於 debug 和理解 network behavior 非常重要。(2) 提供 google cloud platform (GCP) with built-in tensorflow software and tools, 可以做 large scale training and testing.  同樣非常重要。

最近 Matlab (2017a) 開始醒悟追趕。Matlab 的強處是既有的算法和 toolbox (e.g. signal processing, control, etc.), visualization tool.  另外強調 parameter optimisation and code generation for embedded applications.  有機會成為後起之秀。不過無法和雲結合。

What is TensorFlow?

首先 TensorFlow 的名稱原由: Tensor 來自微分幾何。就是 multi-dimensional array (independent of coordinate system).  Tensor 一般是用來表示 (represent) multi-dimensional features.  

Flow 顧名思義來自 graph theory (e.g. probabilistic graph theory) node-to-node 之間的 flow in tensor form and operation (MAC, activation, pooling, etc.).

TensorFlow 主要是用 directed graph 建構複雜的 (deep) learning network, 如 multi-layer convolution neural network (Alexnet, GoogleNet, ResNet, etc.), 或是 long-short term memory, LSTM RNN, 或是更複雜的 network.   


Graph and Session

TensorFlow 在執行時,先建構 graph 再執行。

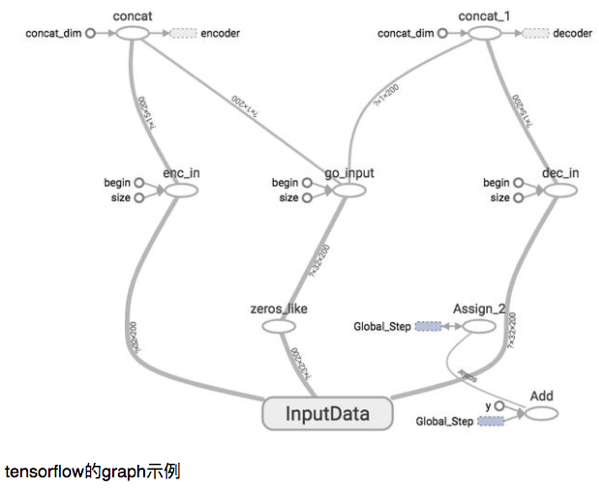
以下是 TensorFlow 執行的 graph 圖示。(Graph) node 代表 data operation, link 代表是 tensor flow.  
NewImage

注意 Graph 不是一個 graph object, 而是每一個 node 都是一個 graph object.  因此一個 session 包含多個 graph objects.

Session 則是一個 session.  

Seesion 有兩種模式。batch mode or interactive mode 如下。

sess = tf.Session()

sess = tf.InteractiveSession()

在 batch mode 時,Session starts with sess = tf.Session(), 接著再 sess.run(). 

在 interactive mode 時,Session starts with sess = tf.InteractiveSession().  再來可以用 Tensor.eval() 和 Operation.run() 得到結果。 這非常有用, 例如 accuracy.eval(), cross_entropy.eval() or sess.run(), op.run().


Variable, Constant, Placeholder

Constant, Variable, Placeholder 就是 (variable) tensor, 基本包含 features (input, intermediate, output, label) and weights (or filter).    Constant and variable 不用多說,但在 TensorFlow 是 tensor form (multi-dimensional array). 這和 matlab 的 variable default 都是 array 一樣。

比較特別的是 placeholder.  其實就是 (tensor) variable.  從 graph 的角度,似乎就是 graph 的 inputs.  以下是 reference2 的說明。

So far we have used Variables to manage our data, but there is a more basic structure, the placeholder.  A placeholder is simply a variable that we will assign data to at a later date.  It allows us to create our operations and build our computation graph, without needing the data.  In TensorFlowterminology, we then feed data into the graph through these placeholders.


Why Placeholder?

為什麼需要 placeholder?  我在看到這篇文章才了解。https://read01.com/AM4BQy.html  直接摘錄:

事實上,Theano也好,Tensorflow也好,其實是一款符號主義的計算框架,未必是專為深度學習設計的。假如你有一個與深度學習完全無關的計算任務想運行在GPU上,你完全可以通過Theano/Tensorflow編寫和運行。

這裡說的符號主義,指的是使用符號式編程的一種方法。 另一種相對的方法是命令式編程。

假如我們要求兩個數a和b的和,通常只要把值賦值給a和b,然後計算a+b就可以了,正常人類都是這麼寫的 (命令式編程):

a=3
b=5
z = a + b

運行到第一行,a真的是3.運行到第2行,b真的是5,然後運行第三行,電腦真的把a和b的值加起來賦給z了。

一點兒都不神奇。

但總有不正常的,不正常的會這麼想問題:a+b這個計算任務,可以分為三步。(1)聲明兩個變量a,b。建立輸出變量z(2)確立a,b和z的計算關係,z=a+b(3)將兩個數值a和b賦值到變量中,計算結果z

後面那種「先確定符號以及符號之間的計算關係,然後才放數據進去計算」的辦法,就是符號式編程。當你聲明a和b時,它們裡面是空的。當你確立z=a+b的計算關係時,a,b和z仍然是空的,只有當你真的把數據放入a和b了,程序才開始做計算。

符號之間的運算關係,就稱為運算圖。

這樣做當然不是閒的無聊,符號式計算的一大優點是,當確立了輸入和輸出的計算關係後,在進行運算前我們可以對這種運算關係進行自動化簡,從而減少計算量,提高計算速度。另一個優勢是,運算圖一旦確定,整個計算過程就都清楚了,可以用內存復用的方式減少程序占用的內存。

Placeholder 就是暫存 a and b, 為了之後賦值!


以最簡單的 softmax 而言如下:

tf.reset_default_graph() 
# graph.version starts with 0
x=tf.placeholder(tf.float32,[None,784],name="x-in")
y_=tf.placeholder(tf.float32,[None,10],name="y-in")
# the following is softmax
W = tf.Variable(tf.zeros([784, 10]))
b = tf.Variable(tf.zeros([10]))
y = tf.nn.softmax(tf.matmul(x, W) + b)

x (input) and y_ (ground truth label) 是 placeholders.   W, b, y 都是 variables.

什麼時候 placeholder 會得到 input data?  就是在 session run 時候。同時用 feed_dict (feed dictionary) 傳送.

以下是一個簡單的例子。


Session with placeholder and feed_dict (1-D and 2-D array)

import tensorflow as tf

x = tf.placeholder("float", None)
y = x * 2

with tf.Session() as session:
    result = session.run(y, feed_dict={x: [1, 2, 3]})
    print(result)
[ 2.  4.  6.]

 
import tensorflow as tf

x = tf.placeholder("float", [None, 3])
y = x * 2

with tf.Session() as session:
    x_data = [[1, 2, 3],
              [4, 5, 6],]
    result = session.run(y, feed_dict={x: x_data})
    print(result)
 
[[  2.   4.   6.]
 [  8.  10.  12.]]


Session with variables, 多一步 tf.global_variables_initializer()


import tensorflow as tf


x = tf.constant([35, 40, 45], name='x')
y = tf.Variable(x + 5, name='y')


model = tf.global_variables_initializer()

with tf.Session() as session:
	session.run(model)
	print(session.run(y))
[40 45 50]


Loss function and Optimiser (in Training)

Machine learning or deep learning 基本就是 optimisation 問題。需要提供 loss function and evoke optimiser.

方式如下:train_step.run

Softmax 的 loss function: cross-entropy;  Optimiser: batch stochastic gradient descent.

cross_entropy = tf.reduce_mean(tf.nn.softmax_cross_entropy_with_logits(labels=y_, logits=y))

train_step = tf.train.GradientDescentOptimizer(0.5).minimize(cross_entropy)

for _ in range(1000):
  batch = mnist.train.next_batch(100)
  train_step.run(feed_dict={x: batch[0], y_: batch[1]})

另一種方法用 sess.run
for i in range(n_train):
    batch_xs, batch_ys = mnist.train.next_batch(batchSize)
    sess.run(train_step, feed_dict={x:batch_xs, y_:batch_ys, keep_prob:1.0})


Evaluation (in both Training and Testing)

Evaluation 有兩個用途:一是在 training 時用來 monitor training (classification) error (不是來自 loss function)。一是找最後的 testing classification error.   


correct_prediction = tf.equal(tf.argmax(y,1), tf.argmax(y_,1))
accuracy = tf.reduce_mean(tf.cast(correct_prediction, "float"))

 
for i in range(n_train):
    batch_xs, batch_ys = mnist.train.next_batch(batchSize)
    sess.run(train_step, feed_dict={x:batch_xs, y_:batch_ys, keep_prob:1.0})

 
testAccuracy = sess.run(accuracy, feed_dict={x:mnist.test.images,y_:mnist.test.labels, keep_prob:1.0})

or 另一方式:
 
correct_prediction = tf.equal(tf.argmax(y,1), tf.argmax(y_,1)) 
accuracy=tf.reduce_mean(tf.cast(correct_prediction,tf.float32)) 
accuracy.eval(feed_dict={x:mnist.test.images,y_:mnist.test.labels})
 

GCP data lab – MNIST NN with Tensorflow

by allenlu2007

Reference:

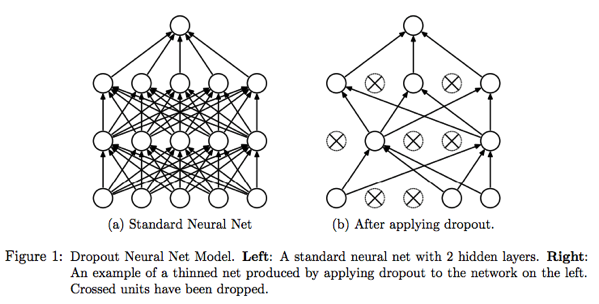
Srivastava, Hinton, et al, https://www.cs.toronto.edu/~hinton/absps/JMLRdropout.pdf


Dropout: A Simple Way to Prevent Neural Networks from Overfitting


Softmax: no need to worry about overfitting


Deep NN: too many parameters,  need to prevent overfit (during the training)

* regularization

* pruning

* dropout


Regularisation: both training and testing

Pruning: both training and testing

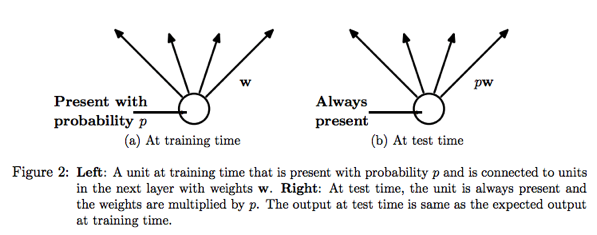
Dropout: Only in training.  


NewImage


NewImage

MNIST Softmax Visualization 2

by allenlu2007


Ref: http://qiita.com/oimou/items/4a4258a7f7cc2bd70afe

同前文同樣用 MNIST with softmax classifier.  但不同的 reference paper.

In summary: imshow (original image), plot(loss), imshow(weights)

主要的差異是前文是用 GD, 本文用 SGD.


from tensorflow.examples.tutorials.mnist import input_data
mnist = input_data.read_data_sets("MNIST_data/", one_hot=True)
Extracting MNIST_data/train-images-idx3-ubyte.gz
Extracting MNIST_data/train-labels-idx1-ubyte.gz
Extracting MNIST_data/t10k-images-idx3-ubyte.gz
Extracting MNIST_data/t10k-labels-idx1-ubyte.gz
import tensorflow as tf
x = tf.placeholder(tf.float32, [None, 784])
W = tf.Variable(tf.zeros([784, 10]))
b = tf.Variable(tf.zeros([10]))
y = tf.nn.softmax(tf.matmul(x, W) + b)
y_ = tf.placeholder(tf.float32, [None, 10])
cross_entropy = tf.reduce_mean(-tf.reduce_sum(y_ * tf.log(y), reduction_indices=[1]))
train_step = tf.train.GradientDescentOptimizer(0.1).minimize(cross_entropy)
sess = tf.InteractiveSession()
tf.global_variables_initializer().run()
import matplotlib.pyplot as plt
import numpy as np

plt.imshow(mnist.train.images[0].reshape([28, 28]))
plt.gray()
NewImage
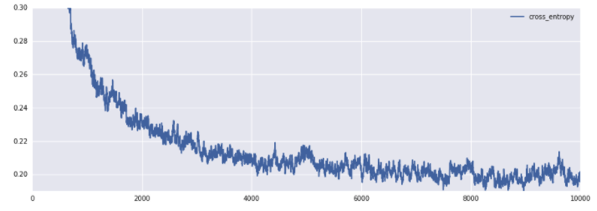
n_train = 10000
n_batch = 100

# for visualization
fig, ax = plt.subplots(1, 1, figsize=(15, 5))
xvalues = np.arange(n_train)
yvalues = np.zeros(n_train)
lines, = ax.plot(xvalues, yvalues, label='cross_entropy')

for i in range(n_train):
    batch_xs, batch_ys = mnist.train.next_batch(n_batch)
    sess.run(train_step, feed_dict={x: batch_xs, y_: batch_ys})
    
    yvalues[i] = cross_entropy.eval(feed_dict={x: mnist.test.images[0:100], y_: mnist.test.labels[0:100]})
    lines.set_data(xvalues, yvalues)
    ax.set_ylim((yvalues.min(), yvalues.max()))
    ax.set_ylim((yvalues.min(), 0.3))
    plt.legend()
    plt.pause(.00001)
NewImage
correct_prediction = tf.equal(tf.argmax(y,1), tf.argmax(y_,1))
accuracy = tf.reduce_mean(tf.cast(correct_prediction, tf.float32))
print(sess.run(accuracy, feed_dict={x: mnist.test.images, y_: mnist.test.labels}))
0.9228
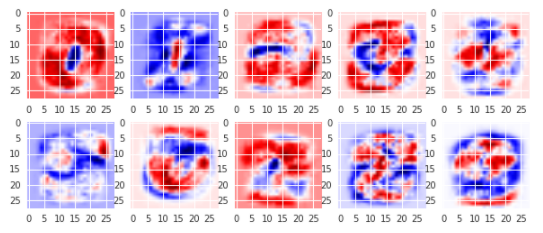
w = W.eval().T
fig = plt.figure(figsize=(10, 4))

for i in range(10):
    ax = fig.add_subplot(2, 5, i + 1)
    ax.imshow(w[i].reshape([28, 28]), cmap="seismic")
NewImage

MNIST NN Visualization

by allenlu2007

Reference: https://medium.com/@awjuliani/visualizing-neural-network-layer-activation-tensorflow-tutorial-d45f8bf7bbc4


再接再厲,繼續 MNIST 使用 convolution neural network classifier.  不過重點不是在準確率,而是在 visualisation.

同樣三部曲:imshow(original image), plot(loss), imshow(weights), 


Some catch:

SGD vs. Adam

Keep_prob ~ dropout : very important to prevent overfit in neural network!


# Visualizing Neural Network Layer
import numpy as np
import matplotlib as mp
%matplotlib inline
import matplotlib.pyplot as plt
import tensorflow as tf
import tensorflow.contrib.slim as slim
from tensorflow.examples.tutorials.mnist import input_data
import math
mnist = input_data.read_data_sets("MNIST_data/", one_hot=True)
Extracting MNIST_data/train-images-idx3-ubyte.gz
Extracting MNIST_data/train-labels-idx1-ubyte.gz
Extracting MNIST_data/t10k-images-idx3-ubyte.gz
Extracting MNIST_data/t10k-labels-idx1-ubyte.gz

Next we define our convolutional network. It will be a network with three sets of convolution -> pooling layers, followed by a fully connected softmax layer. I have choosen 5,5,20 to begin with. Feel free to adjust the number of convolutional filters at each layer. It is these filters we will be visualizing, so we can see in realtime what features are learned from the dataset with more or less filters.

tf.reset_default_graph()

x = tf.placeholder(tf.float32, [None, 784],name="x-in")
y_ = tf.placeholder(tf.float32, [None, 10],name="y-in")
#x = tf.placeholder(tf.float32, [None, 784])
#y_ = tf.placeholder(tf.float32, [None, 10])
keep_prob = tf.placeholder("float")

# the following is softmax
#W = tf.Variable(tf.zeros([784, 10]))
#b = tf.Variable(tf.zeros([10]))
#y = tf.nn.softmax(tf.matmul(x, W) + b)

x_image = tf.reshape(x,[-1,28,28,1])
hidden_1 = slim.conv2d(x_image,5,[5,5])
pool_1 = slim.max_pool2d(hidden_1,[2,2])
hidden_2 = slim.conv2d(pool_1,5,[5,5])
pool_2 = slim.max_pool2d(hidden_2,[2,2])
hidden_3 = slim.conv2d(pool_2,20,[5,5])
hidden_3 = slim.dropout(hidden_3,keep_prob)
y = slim.fully_connected(slim.flatten(hidden_3),10,activation_fn=tf.nn.softmax)

# cross_entropy = -tf.reduce_sum(y_*tf.log(out_y))
cross_entropy = tf.reduce_mean(-tf.reduce_sum(y_*tf.log(y), reduction_indices=[1]))
correct_prediction = tf.equal(tf.argmax(y,1), tf.argmax(y_,1))
accuracy = tf.reduce_mean(tf.cast(correct_prediction, "float"))
#train_step = tf.train.AdamOptimizer(1e-4).minimize(cross_entropy)
train_step = tf.train.GradientDescentOptimizer(0.1).minimize(cross_entropy)
sess = tf.InteractiveSession()
tf.global_variables_initializer().run()
#init = tf.global_variables_initializer()
#sess.run(init)

batchSize = 100
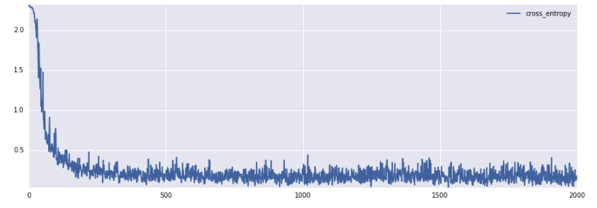
n_train = 2001

# for visualization
fig, ax = plt.subplots(1, 1, figsize=(15, 5))
xvalues = np.arange(n_train)
yvalues = np.zeros(n_train)
lines, = ax.plot(xvalues, yvalues, label='cross_entropy')

for i in range(n_train):
    batch_xs, batch_ys = mnist.train.next_batch(batchSize)
    sess.run(train_step, feed_dict={x:batch_xs, y_:batch_ys, keep_prob:1.0})
    #batch = mnist.train.next_batch(batchSize)
    #sess.run(train_step, feed_dict={x:batch[0], y_:batch[1], keep_prob:0.5})
    if i % 1000 == 0 and i != 0:
        trainAccuracy = sess.run(accuracy, feed_dict={x:batch_xs,y_:batch_ys, keep_prob:1.0})
        print("step %d, training accuracy %g"%(i, trainAccuracy))

    yvalues[i] = cross_entropy.eval(feed_dict={x: mnist.test.images[0:100], y_: mnist.test.labels[0:100], keep_prob:0.5})
    lines.set_data(xvalues, yvalues)
    ax.set_ylim((yvalues.min(), yvalues.max()))
    #ax.set_ylim((yvalues.min(), 0.3))
    plt.legend()
    plt.pause(.00001)
        
step 1000, training accuracy 1
step 2000, training accuracy 1
NewImage
testAccuracy = sess.run(accuracy, feed_dict={x:mnist.test.images,y_:mnist.test.labels, keep_prob:1.0})
print("test accuracy %g"%(testAccuracy))
test accuracy 0.9795

Now we define a couple functions that will allow us to visualize the network. The first gets the activations at a given layer for a given input image. The second plots those activations in a grid.

def getActivations(layer,stimuli):
    units = sess.run(layer,feed_dict={x:np.reshape(stimuli,[1,784],order='F'),keep_prob:1.0})
    plotNNFilter(units)
def plotNNFilter(units):
    filters = units.shape[3]
    plt.figure(1, figsize=(20,20))
    n_columns = 6
    n_rows = math.ceil(filters / n_columns) + 1
    for i in range(filters):
        plt.subplot(n_rows, n_columns, i+1)
        plt.title('Filter ' + str(i))
        plt.imshow(units[0,:,:,i], interpolation="nearest", cmap="gray")
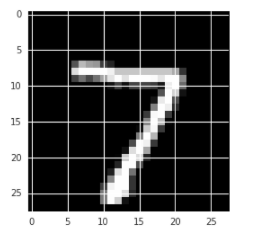
imageToUse = mnist.test.images[0]
plt.imshow(np.reshape(imageToUse,[28,28]), interpolation="nearest", cmap="gray")
<matplotlib.image.AxesImage at 0x7fa3a26a2250>
NewImage

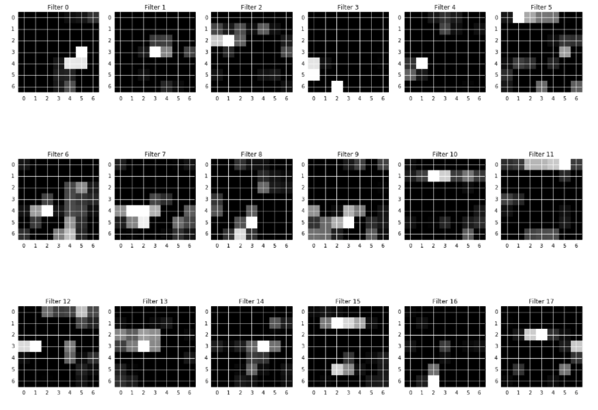
Now we can look at how that image activates the neurons of the first convolutional layer. Notice how each filter has learned to activate optimally for different features of the image.

getActivations(hidden_1,imageToUse)
NewImage
getActivations(hidden_2,imageToUse)
NewImage
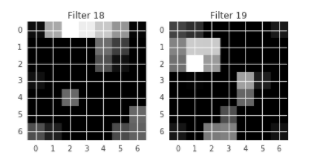
getActivations(hidden_3,imageToUse)
NewImage NewImage


MNIST Softmax Visualization

by allenlu2007

Reference: https://gist.github.com/awjuliani/5ce098b4b76244b7a9e3


MNIST 加上 Softmax 分類器是教科書經典組合。直接用 GCP datalab 的 jupyter notebook 顯示。

In summary: imshow(original image), imshow(weights), plot(loss) 

Softmax Tutorial

First we import the needed libraries.

import pandas as pd
import numpy as np
import matplotlib.pyplot as plt
%matplotlib inline
import scipy.sparse

Next we import MNIST data files. We use 500 training examples, and 100 test examples.

from tensorflow.examples.tutorials.mnist import input_data
mnist = input_data.read_data_sets("MNIST_data/", one_hot=False)
batch = mnist.train.next_batch(500)
tb = mnist.train.next_batch(100)
Extracting MNIST_data/train-images-idx3-ubyte.gz
Extracting MNIST_data/train-labels-idx1-ubyte.gz
Extracting MNIST_data/t10k-images-idx3-ubyte.gz
Extracting MNIST_data/t10k-labels-idx1-ubyte.gz

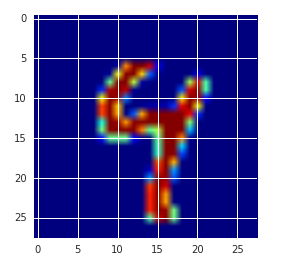
Let’s take a look at one of the images in the set. Looks like a 4! Add colormap, cmap=’jet’ to use the colorbar

exampleNumber = 2 #Pick the example we want to visualize
example = batch[0][exampleNumber,:] #Then we load that example.
plt.imshow(np.reshape(example,[28,28]),cmap='jet') #Next we reshape it to 28x28 and display it.
<matplotlib.image.AxesImage at 0x7fa009767790>
NewImage


Matplotlib.pyplot 的 imshow(), image show, 是非常重要的 function.  同樣 OpenCV, Matlab, Octave 都用一樣的 function, imshow(), 作為 show image 的基本 function.
 

y
= batch[1] x = batch[0] testY = tb[1] testX = tb[0]

Before we can get to training our model using the data, we will have to define a few functions that the training and testing process can use.

Here we define the loss function for softmax regression.

def getLoss(w,x,y,lam):
    m = x.shape[0] #First we get the number of training examples
    y_mat = oneHotIt(y) #Next we convert the integer class coding into a one-hot representation
    scores = np.dot(x,w) #Then we compute raw class scores given our input and current weights
    prob = softmax(scores) #Next we perform a softmax on these scores to get their probabilities
    loss = (-1 / m) * np.sum(y_mat * np.log(prob)) + (lam/2)*np.sum(w*w) #We then find the loss of the probabilities
    grad = (-1 / m) * np.dot(x.T,(y_mat - prob)) + lam*w #And compute the gradient for that loss
    return loss,grad

The below function converts integer class coding, where there is a unidimensional array of labels into a one-hot varient, where the array is size m (examples) x n (classes).

def oneHotIt(Y):
    m = Y.shape[0]
    #Y = Y[:,0]
    OHX = scipy.sparse.csr_matrix((np.ones(m), (Y, np.array(range(m)))))
    OHX = np.array(OHX.todense()).T
    return OHX

Here we perform the softmax transformation: This allows us to get probabilities for each class score that sum to 100%.

def softmax(z):
    z -= np.max(z)
    sm = (np.exp(z).T / np.sum(np.exp(z),axis=1)).T
    return sm

Here we determine the probabilities and predictions for each class when given a set of input data:

def getProbsAndPreds(someX):
    probs = softmax(np.dot(someX,w))
    preds = np.argmax(probs,axis=1)
    return probs,preds

This is the main loop of the softmax regression.

Here we initialize our weights, regularization factor, number of iterations, and learning rate. We then loop over a computation of the loss and gradient, and application of gradient.

w = np.zeros([x.shape[1],len(np.unique(y))])
lam = 1
iterations = 1000
learningRate = 1e-5
losses = []
for i in range(0,iterations):
    loss,grad = getLoss(w,x,y,lam)
    losses.append(loss)
    w = w - (learningRate * grad)
print loss
323.250245594
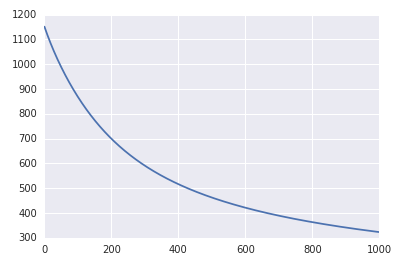
plt.plot(losses)
[<matplotlib.lines.Line2D at 0x7fa0099b7090>]
NewImage
def getAccuracy(someX,someY):
    prob,prede = getProbsAndPreds(someX)
    accuracy = sum(prede == someY)/(float(len(someY)))
    return accuracy
print 'Training Accuracy: ', getAccuracy(x,y)
print 'Test Accuracy: ', getAccuracy(testX,testY)
Training Accuracy:  0.902
Test Accuracy:  0.85

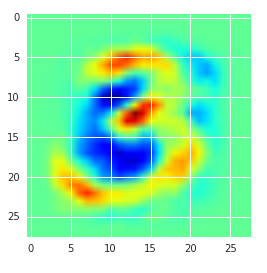
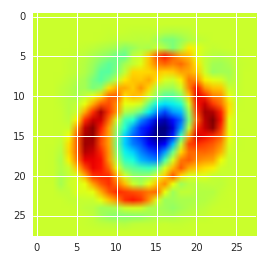
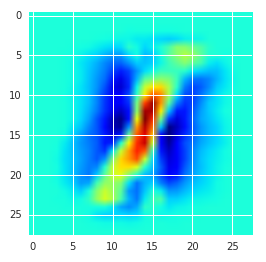
One of the benefits of a simple model like softmax is that we can visualize the weights for each of the classes, and see what it prefers. Here we look at the weights for the ‘3’ class.

classWeightsToVisualize = 3
plt.imshow(scipy.reshape(w[:,classWeightsToVisualize],[28,28]),cmap='jet')
<matplotlib.image.AxesImage at 0x7fa009695d50>

NewImage

classWeightsToVisualize = 0
plt.imshow(scipy.reshape(w[:,classWeightsToVisualize],[28,28]),cmap='jet')
<matplotlib.image.AxesImage at 0x7fa0095d9d10>
NewImage
classWeightsToVisualize = 1
plt.imshow(scipy.reshape(w[:,classWeightsToVisualize],[28,28]),cmap='jet')
<matplotlib.image.AxesImage at 0x7fa009517710>
NewImage

GCP datalab – MNIST with Tensorflow

by allenlu2007


前文 說明用 GCP + tensorflow 解決 MNIST 問題。 

Solution 1: Softmax classifier.  Accuracy 92%.  Very bad.

Solution 2: Neural network.  Accuracy 99.2%.   Pretty good.


不過前文是用 core/project (Ubuntu OS or Debian OS) + Anaconda (python, numpy, matplotlib) + tensorflow.

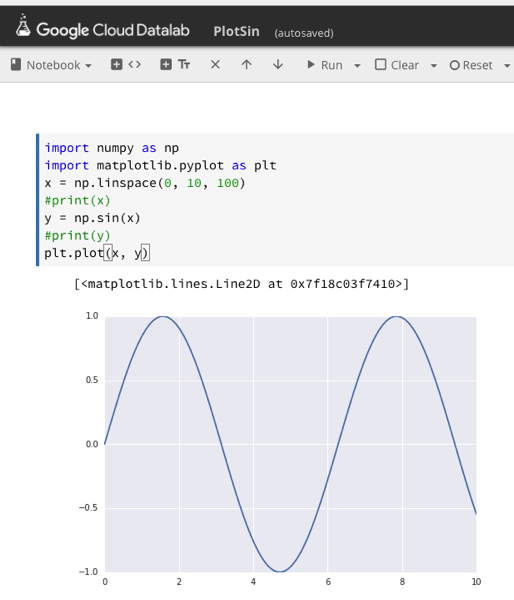
一個更簡單的方法是直接用 GCP + cloud shell + datalab (default jupyter notebook) + tensorflow.

好處是 (1) 不需要用 Anaconda install python, datalab by default 包含 python, numpy, matplotlib, tensorflow.  不過沒有包含 caffe, scikit-learn packages. 需要自己再 install. (2) datalab by default 使用 jupyter notebook.  可以做出圖文並茂的 notebook.  程序如下。


Step 0:  GCP cloud shell to select core/project 

Step 1:  GP cloud shell to create datalab instance (i.e. VM).  

也就是說 datalab 是一個 VM.  這可以在 Google Cloud Platform dashboard 的 VM instances 看到。

> datalab create instance-name (e.g.  datalab create jupyter-trial)

如果之後要 delete datalab VM!   > datalab delete instance-name


Step 2: 比較特別的是 datalab (jupyter notebook) VM 使用方式似乎是用為 server.  需要再開 web preview browser to connect to the datalab VM!!  

所有的 notebook 都是存在 web preview browser.  這造成兩個問題: (1) web preview browser 常常斷線,怎麼辦?(2) 如何保存或備份 notebook?

(1) 只要 datalab VM 存在(可以在 GCP dashboard 看到), 可以用

> datalab connect instance-name  重新讓 web preview browser 連回 datalab VM.

(2) 終於找到 jupyter notebook 放在哪裡。如果是是在 VM instance (e.g. jupyter-trial) 內: 

/mnt/disks/datalab-pd/content/datalab/notebooks

Reference: https://cloud.google.com/datalab/docs/how-to/working-with-notebooks  (path is wrong!)

如果是在 cloud shell, 則是在:

datalab@instance-name:/mnt/disks/datalab-pd/content/datalab/notebooks

不過 access 的方式需要用 gcloud command.  舉例而言 copy from datalab VM to cloud shell.

> gcloud compute copy-files datalab@jupyter-trial:/mnt/disks/datalab-pd/content/datalab/notebooks jupyter-trial-notebooks 

上述 command copy datalab VM 上的 notebooks folder copy 到 cloud 的 jupyter-trial-notebooks folder.


另外 GCP 自動備份每一個 project 的所有 files in zip format.

$ gsutil ls gs://compute-engine-166715/datalab-backups/asia-east1-a/jupyter-trial/content/

gs://compute-engine-166715/datalab-backups/asia-east1-a/jupyter-trial/content/daily-20170616151645

gs://compute-engine-166715/datalab-backups/asia-east1-a/jupyter-trial/content/daily-20170617152646

gs://compute-engine-166715/datalab-backups/asia-east1-a/jupyter-trial/content/hourly-20170618021646

所以不用再備份 notebook. 只要 copy (用 gsutil cp gs://….  就可).


另外還有 Storage API and BigQuery API, 之後再研究。


General question: 如何 visualize convergence? 使用Use tensorBoard.  TBA


Step 3:  MNIST using softmax classifier on Google CloudDatalab

Reference: https://www.tensorflow.org/get_started/mnist/beginners

NewImage

92% 的準確度並不好,其實是比較差。


Step 4:  MNIST using multi-layer neural network classifier on Google CloudDatalab

Reference: https://www.tensorflow.org/get_started/mnist/pros

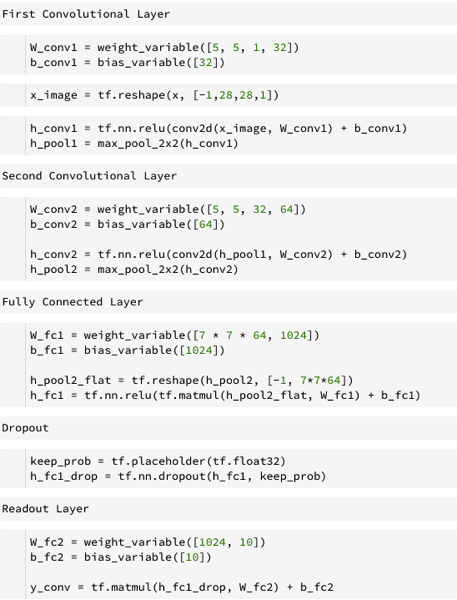
第一階段是建立 model.

NewImage

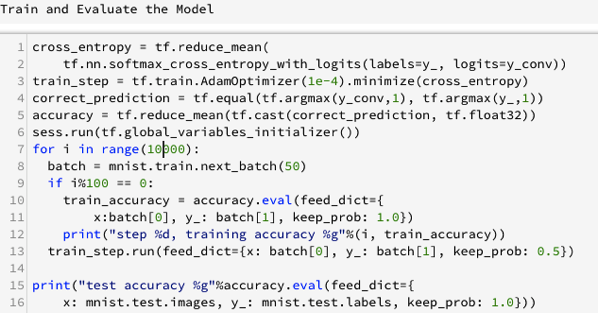
第二階段是 train and evaluate the model.

NewImage

test accuracy 0.9855, or 98.6%

如何監看收斂情況

Jupyter Notebook Using GCP

by allenlu2007

In summary, very simple!

No need to install python, matplotlib, … anaconda, blah, blah…


Reference: 

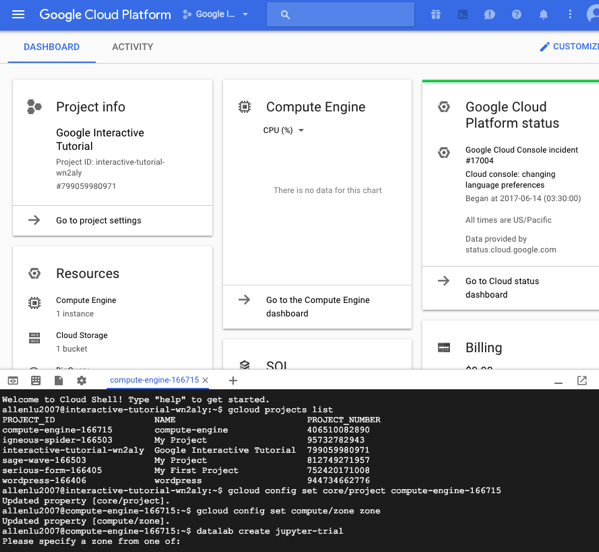
https://console.cloud.google.com/getting-started?project=interactive-tutorial-wn2aly&authuser=1

NewImage

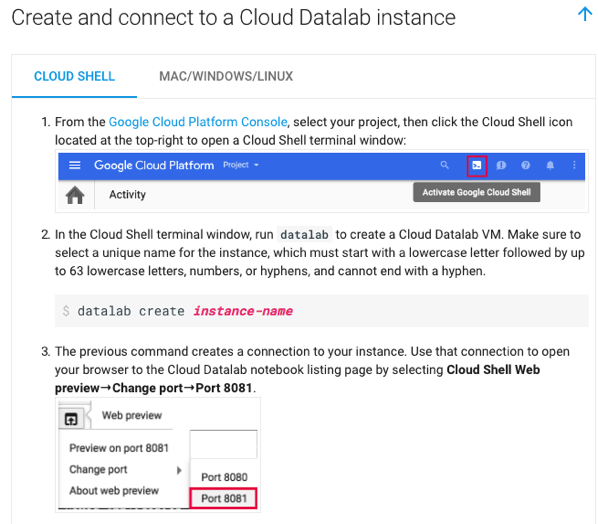
How to Create and Connect to a Cloud Datalab?

https://cloud.google.com/datalab/docs/quickstarts


NewImage


NewImage


After clicking web-preview ==> new web page with notebook!!!

NewImage


BCD – 嬰兒哭聲

by allenlu2007

Audio signal detection 的一個實際的應用就是 BCD.  全世界的嬰兒哭聲基本都類似, hardwire 在大腦中。

Reference:   Infant Cry Analysis and Detection.

Cry samples: http://sirkan.iit.bme.hu/~varallyay/crysamples.htm

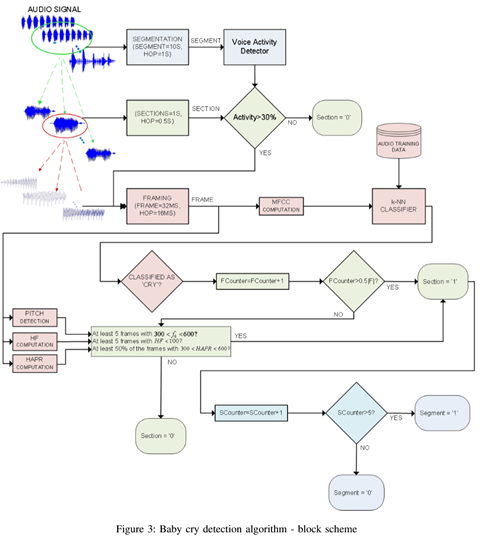
下圖是大致流程圖。audio signal => VAD => Framing => MFCC => k-NN

image

Audio Source

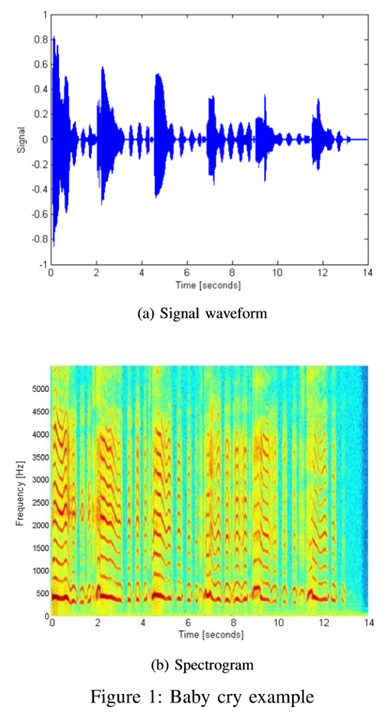
Time domain and short time spectrogram 如下圖。幾個特點

* Time domain – Burst signals

* Frequency domain – Rich harmonics and frequency chirping

image

Feature Extraction

1. Pitch frequency – 也就是 fundamental frequency f0  因爲嬰兒發聲的物理特性會有 prior information, 可以用來分類。

2. Short-time energy (STE) – 可以用來作爲 VAD (voice activity detection).

image

3. Mel-Frequency Cepstrum Coefficients (MFCC) – 如前文,對於 harmonics rich audio signal (e.g. voice) 應該很有用。

image

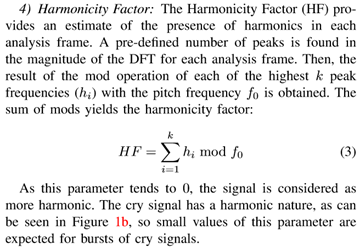
4. Harmonicity Factor (HF) – 定義如 reference, confusing to me.

image

5. Harmonic to average power ratio (HARP) – 類似 time domain peak-to-average power ratio. 

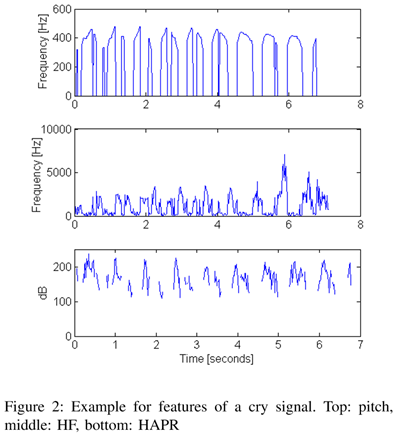
下圖 show 1 (fo)/4 (HF)/5 (HARP).  HF 好像是 frequency? very confusing to me.

image

6. Burst frequency – 嬰兒哭聲一般有周期性。如 waveform and spectrogram 所示。  但在嘈雜的環境,不能衹用 power.  還是要用 frequency spectrum (DFT) 的最大值。

7. Rise-time and Fall-time of the short-time energy – STE 的 rise time and fall time.

BCD Algorithm

三個主要的 algorithms (i) Voice Activity Detection (VAD); (ii) Classification: use k-NN algorithm.  ‘Cry’ (1) and ‘No cry’ (0);  (iii) post-processing to reduce the false alarm.

VAD: voice signal is divided into consecutive and overlapping segments, each of 10sec, with a step of 1second.

Matlab Advanced Data Structure

by allenlu2007

Reference (oopmatlab)

http://blog.sina.com.cn/s/blog_4cf8aad30102wcu3.html

http://www.ilovematlab.cn/article-52-1.html

http://www.ilovematlab.cn/article-53-1.html

http://www.ilovematlab.cn/article-54-1.html


第一代的 matlab user (包含我)主要驚艷於 (numerics) array data type.  可以很方便做 matrix and vector operations. 特別是 element-wise operation (e.g. .* .^) 獨樹一幟,非常有用。但之後缺乏亮點,雖然也有 OOP matlab, 比起其他高階語言如 python (caffe, tensorflow) or ruby,  並沒有引起太大的注意 (at least for me).

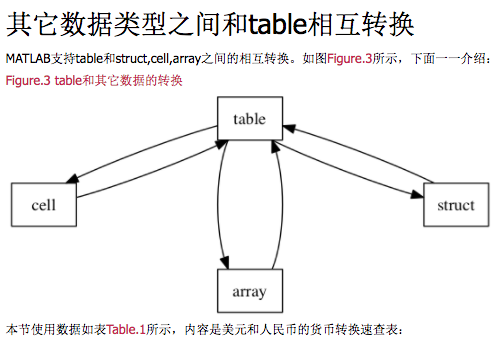
隨著 machine learning and deep learning 變成主流應用。Matlab 終於找到新的舞台。除了提供相關的 toolbox, app, xxxLearner (e.g. ClassificationLearner),  visualization tools 之外。也更新了 data structure and load function.  本文討論 Matlab advanced data structure.  除了常用的 int, float, char, function or file handles, struct 外,比較 advanced data structure 有 cell, containers.Map, table, enumeration, and time series.


Cell  (類似 Ruby Array [] )

以下表為例。Matlab array data structure 只能處理數值,無法處理字串。需要新的 data structure.

NewImage

Cell 可以處理字串。可視為 array 概念延伸至字串!  

NewImage

也可以用 for loop access content

NewImage


以電話簿而言,重點是查詢電話號碼。理想而言 operation 如下:

NewImage

但 cell 無法如此。只能間接用 for loop + 比較的方法。

NewImage

或是用兩個 cells, 再用 index 把兩個 cells 關聯起來。

NewImage

1. 兩種方法無一例外,都需要 linear search 所有的 cell array, 非常沒效率。

BTW, 因為 matlab 沒有 foreach loop!!!!  比起 perl, python, ruby 實在是一大敗筆。從 cell element 的定義,到 for loop 的表述,都很冗長。Matlab 的 cell 是 indexed (類 Ruby) array.  

例如在 python or ruby 中:

NewImage

但在 matlab 中硬要塞 index i 在 cell 的定義和 access.  Very ugly 😦

NewImage

2. 無法方便的验证重复数据。电话号码簿要求每一个人的名字都是独一无二的,所以在数据录入的时候要防止姓名的重复,但是我们没有其它办法知道某名字是否已经被使用过了,除非在每次输入的时候都对整個 cell 里的内容做遍历比较。

3. 無法方便地添加内容。如果电话号码簿中的记录需要不断地增长,但是我们没有办法在一开始就估计出其大概的数量,于是无法有效的预先分配記憶體,所以添加数据时,一旦超过预先分配的量,MATLAB就要重新分配記憶體了。

4. 無法方便地删除内容。如果我们要从 cell 中去掉某一记录,可以找到该记录,并把该位置的 cell 内容置空,但这并不会自动减小 cell array 的长度,如果这样的删减操作多了,cell 中会留下很多没有利用的空余位置。

5. 不方便作为函数的参数,具体原因见struct的局限性.


Struct   (類似 C struct {})

雖然有點不倫不類,可以用 struct 來做以上的設定:

NewImage

NewImage

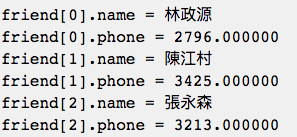
應該沒有人會直接用人名做 structure.  一般還是會用 addressBook.name and addressBook.phone 來做 structure 如下。如果如此就和 cell 沒什麼不同。

NewImage

Matlab Struct 常用來做為和 C 對接的用途。


Containers.Map  (類似 Ruby Hash {} )

其實就是 Perl: associative array %;  Ruby: hash {};  Python: dictionaries {}.   搭配 foreach, key/value pair functions 非常方便。但是 matlab 原先只有 cell, 而且佔用的 {}.  只好再創造出 Containers.Map data structure 😦  

之前提到 matlab 沒有 foreach,  對於 cell, struct, (table?) 的查詢都很麻煩。但在 Containers.Map 因為有 key/value pair 關係,可以用其他搜尋方式或 functions (e.g. remove, add …)

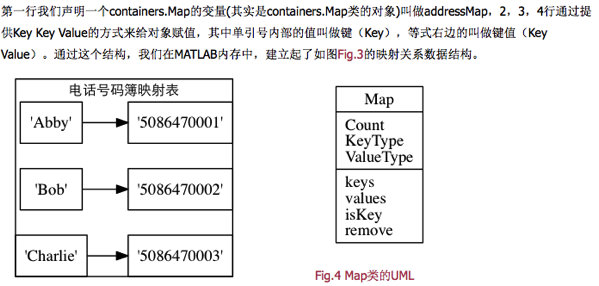
 NewImage

 NewImage

右邊的 Map 是什麼意思?key/value 就是左邊的映射表。Count,KeyType,ValueType 如下。

NewImage

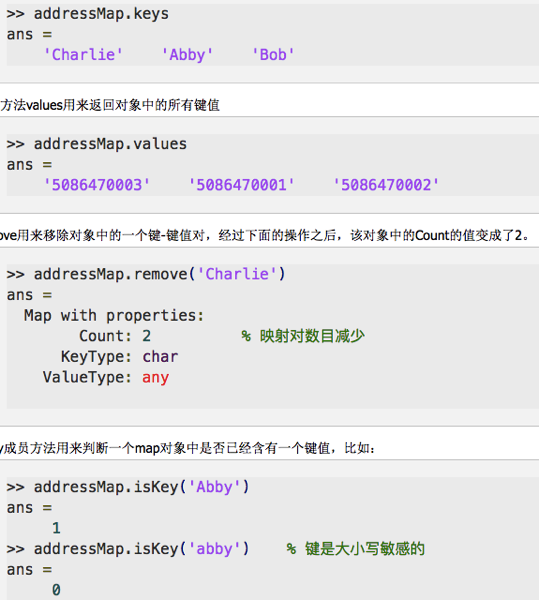
Keys, values, isKey, remove 都是 functions.

NewImage


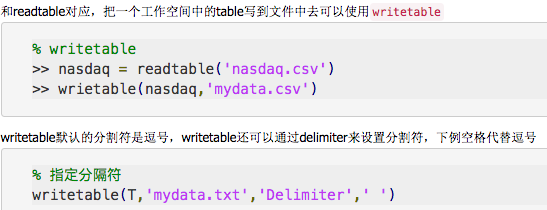
Table (Matlab 獨創 for machine learning and big data?)

Matlab 2013b 引入新的 data structure 叫做 table.  Table 類似 statistics toolbox 的 dataset.  Table 的目的就是取代 dataset.   Table 用於各類數據,比起 (numerics) array and cell 更廣泛。

Table 本质上来说是一种可以存放各种 data type 的容器,比如下面表中的 data,其中既有 char,又有 numerics,其中第一行作为表頭:Symbol,Name,Market,Cap,IPO, Year是各列的名字。

NewImage

Array 的局限性在于不能用来存放数值以外的数据,而使用 cell 读取和索引内容时有种种不方便,比如无法区分该 data 中的表頭和其余的 data.

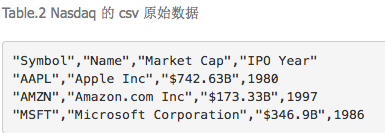
一般 data 可能放在 csv file 如下。

NewImage

用 load or tblread (tabular data read) 顯然不行。因為其中有 char data type.  Matlab 最早只處理 numerics data type!  這是 matlab 的優點,但也是最大的缺點。如果用 importdata 也會有同樣的狀況如下。顯然不是我們所要的。

NewImage


如何建造 table

1. Use readtable function to read a tabular file, return a table object.

NewImage

注意第2行的warning,因为readtable 函数把nasdaq.csv中的第一行自动变成了这个table的表頭,在创建table object 的时候,MATLAB会对做表頭的文字做处理,这里把Market Cap和IPO Year两个词中的空格去掉,缩成一个词,这样做是为了方便将来使用dot语法来 access data。因为MATLAB修改了原来的表頭,所以这里给出了warning。


2. Use table() function to create a table object. 以上節電話簿為例。

Table 可由 row cell and column cell 組成。

下面程序中第1,2行用 column cells 来表示表中每一列的数据,第3行用 row cell 规定了表頭的名称,第4行调用table的构造函数创建table object,先输入 data,再输入表頭的名称。表頭通过table object 的VariableNames属性来设置。

NewImage


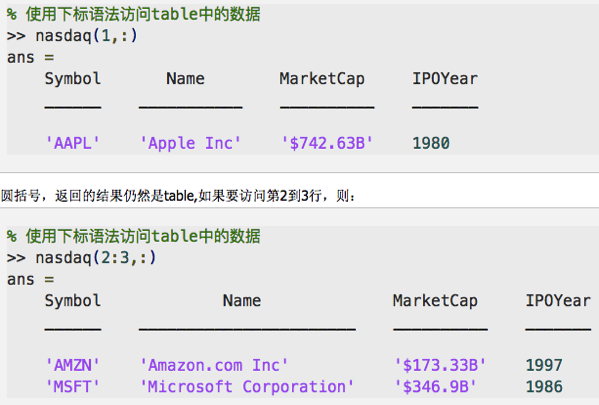
 如何 access table

Access table 需要使用 index.

NewImage

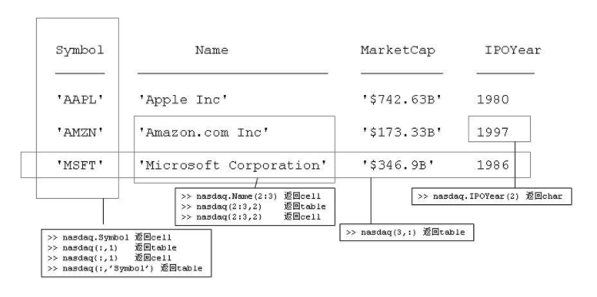
注意使用 () 時, return object 仍是 table.  但使用 {}, return object 時 column cell!!

NewImage 

下表顯示幾種 access table 方式。

NewImage


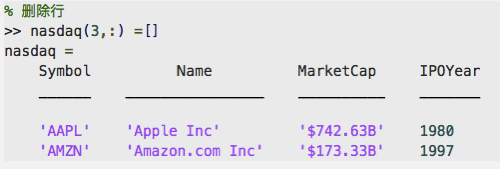
如何刪除 table row and column

Delete row:  只要對該行置空即可。

NewImage

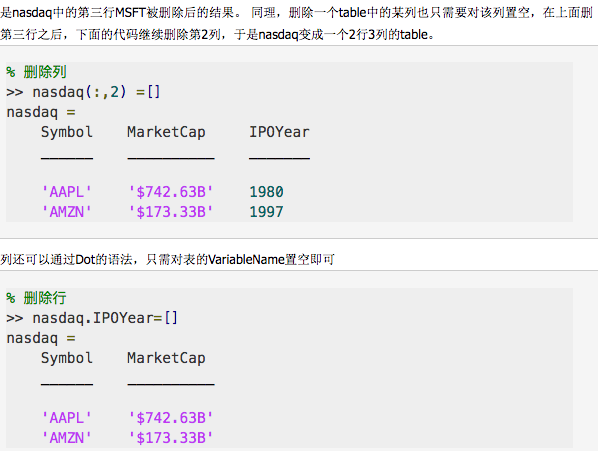
Delete column: 同理,只要對該列置空即可。

NewImage


如何增加 table row and column

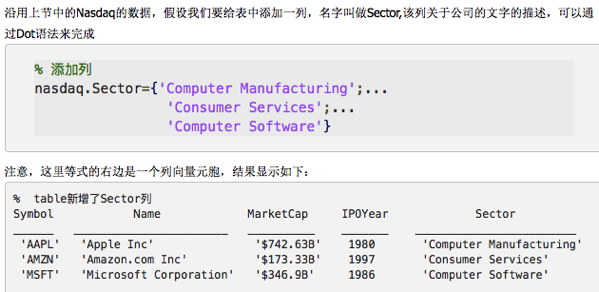
增加 column(列)比較麻煩:

NewImage

前節提到,把table中的 row data 取出来,该 row data type 仍然是table。同理,如果想要给table添加一行,该行也必须是一个 table,可以通过下面的方法给 table 添加行:

NewImage

其中第1行先构造一个包含数据的 cell,第二行把该 cell 转成一个table,但是尚未指定表頭,第三行指定表頭,第四行把nasdaq和新建的table进行串接构成新的table。

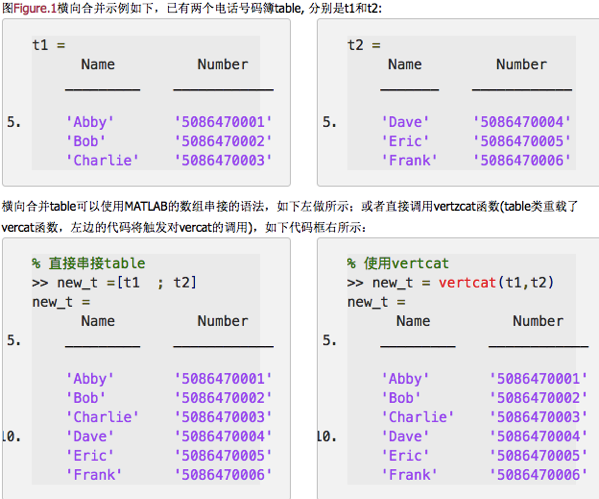
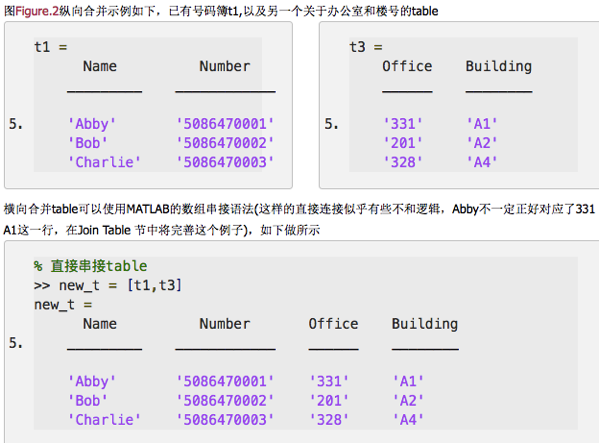
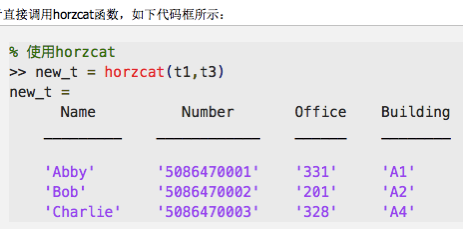
也就是 (1) 先把 cell 轉換成 table; (2) 確認 variableNames 要一致; (3) table 合併只要用 [ tb1; tb2]. 就像是字串合併。不過要注意用 “;” 而不是 “,” .


如何合併 tables

NewImage


NewImage 

NewImage

NewImage


輸出 table

 NewImage

NewImage


NewImage

語音信號處理–Mel Frequency Cepstrum Coefficients (MFCCs)

by allenlu2007

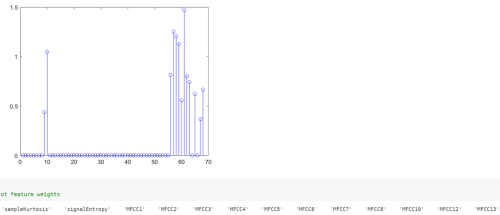
承上文 PhysioNet 2016 challenge, 最重要的 features 是 MFC (Mel Frequency Cepstrum) 係數的前 13 項。再加上 sample kurtosis and sample entropy.   到底 Mel Frequency Cepstrum Coefficients 是什麽?爲什麽有效?

本文主要參考: http://research.cs.tamu.edu/prism/lectures/sp/l9.pdf

以及 http://mirlab.org/jang/books/audioSignalProcessing/speechFeatureMfcc_chinese.asp?title=12-2%20MFCC

This lecture is based on [Taylor, 2009, ch. 12; Rabiner and Schafer, 2007, ch. 5; Rabiner and Schafer, 1978, ch. 7 ] 

Cepstrum

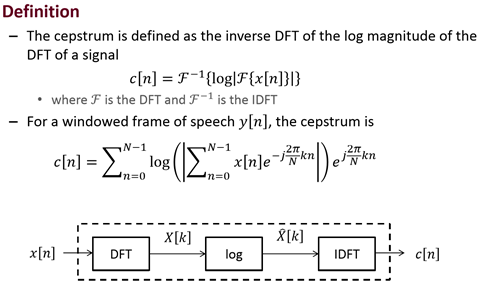
Spectrum 的定義是 20log10|F{x[n]}| or 10log10|F{x[n]}|.  Spectrum 把字首反排成 Cepstrum, 定義也很特別。簡單來説就是 Cepstrum = IDFT{Spectrum}.   

image

1. abs and log operations 自動把 phase information 消除 (but frequency information keeps). 對於 communication 是罪惡,但對 voice 似乎無妨。也許是耳朵對 phase 不敏感。但對 log (frequency response) 敏感。

2. abs and log operations 都是 nonlinear operations.  因此 c[n] 不會是 x[n] 的 replica 或是 linear filtering.  c[n] 的 harmonics 部分會加强。 c[n] is complex sequence?  如果改爲 DCT (discrete cosine transform) 就會變成 real sequence.

Examples

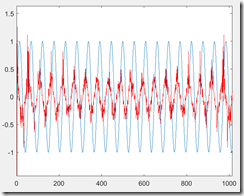
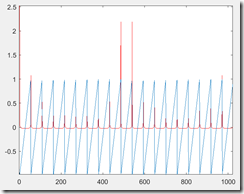
1. x[n] 是 pure sine wave.  After DFT, ABS, and LOG 仍然得到 c[n] 是 sine wave 如下圖左。rceps(sin[x])

很明顯一般的聲音不是如此。如果是周期 waveform with harmonics, 在 abs and log operations 之後,加强 harmonics 部分。在 DCT 之后加强 waveform 的 distortion.  例如 sawtooth waveform 最後得到的 cepstrum 如下圖右。基本上還是保持類周期性質,衹是 distortion 更嚴重。rceps(sawtooth[x]) 

image  image

Cepstrum 的新詮釋

前段提到 Cepstrum = IDFT{Spectrum}, 是從比較 x[n] and c[n] 角度出發。 

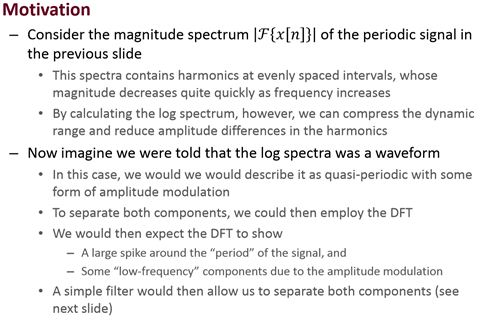
但在 reference  給了一個完全不同的詮釋如下。重點是: log spectra (power spectrum) 視爲 waveform!  IDFT 是用來分開 power spectrum 的 frequency and amplitude modulation.

image

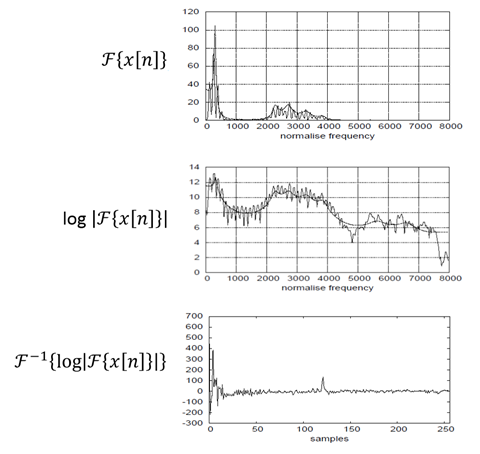
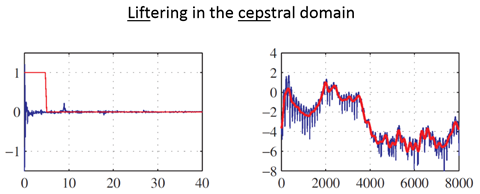
下圖就是一個例子。log spectrum 在 log 后變得像 periodic waveform.  在 IDFT 后對應高頻部分是 power spectrum 上的 ripple.  如果在 cepstrum 加上 filter, 可以移除 ripple, 稱爲 liftering.  Liftering 有實際的用途嗎?

image

image

System Convolution

OFDM 一個最大的優點就是把 system convolution 轉換爲 multiplication (FEQ). 

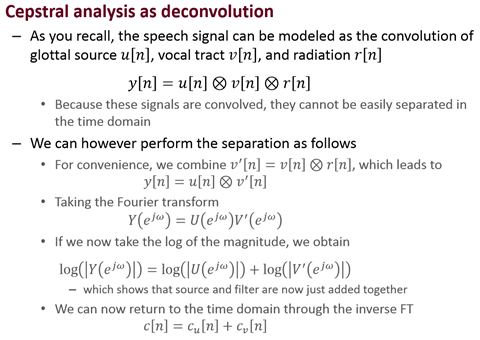
同樣 Cepstrum 的一個很大的優點也是如此。把 system convolution 轉換爲 addition.

這對聲音很重要。可以分開 source and filter.  Source: glottal excitation, 對應 high frequency coefficients.  Filter: vocal tract, 對應 low frequency coefficients.

image

Comparison of LPC, STFT, Cepstrum smoothing, and Homomorphic smoothing

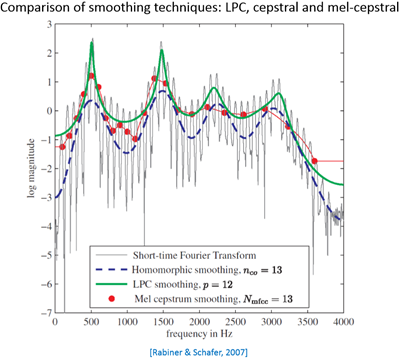
回到 frequency domain (spectrum), 我們可以比較幾種常見的語音算法,包含 Short-time Fourier transform (STFT), LPC (Linear Predictive Coefficients), Homomorphic smoothing, Mel-cepstral smoothing.  How about wavelet?  結果如下:

STFT: 似乎最大的問題是 ripple, 也就是無法分開 source and filter?

LPC, Homomorphic, and Mel-Cepstrum 看來 spectrum 都很像。重點還是在 parameter domain (time domain for STFT, qerfreny for cepstraum, etc.)  是否有明顯可辨識的特徵。

image

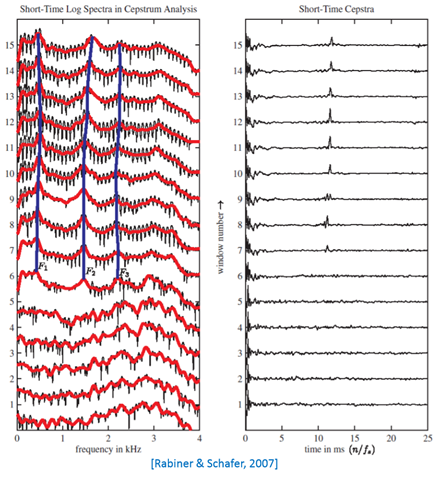
Voice detection 是常見的應用。以下是常見參數 for speech signal.

50-ms window, 12.5-ms shift,

Fs=8KHz, Nmfcc = 14 (number of cestral coefficients) , and R = 22 (cepstral sine lifter parameter).

In summary, Mel Cepstrum works 的主要因素是 harmonic rich signal!  經由 log operation 放大 harmonics, 再經由 DCT 得到 cepstrum spike.

image