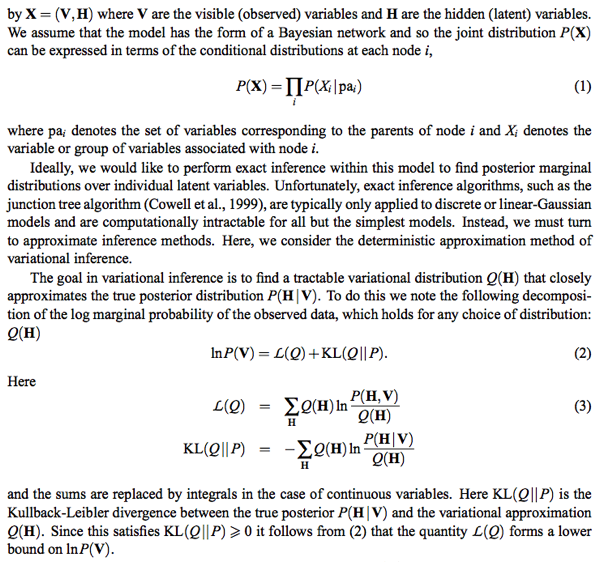
之前花了很多時間了解 Kalman filter (見前文)。主要在 recursive equation 的推導,physical insight (least square minimisation, state space model of Gaussian distribution).
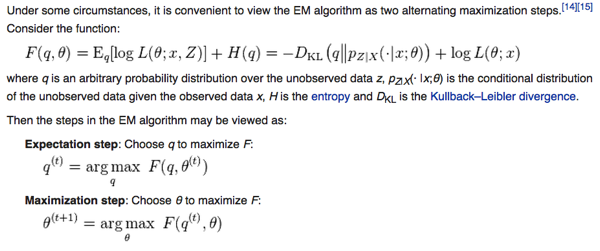
進階包含: Kalman filter 和 Kalman smoother 的差異. 以及當 variance 未知時用 EM algorithm 來求解。
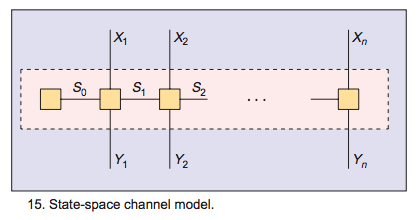
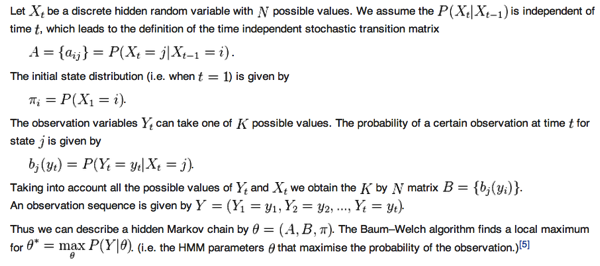
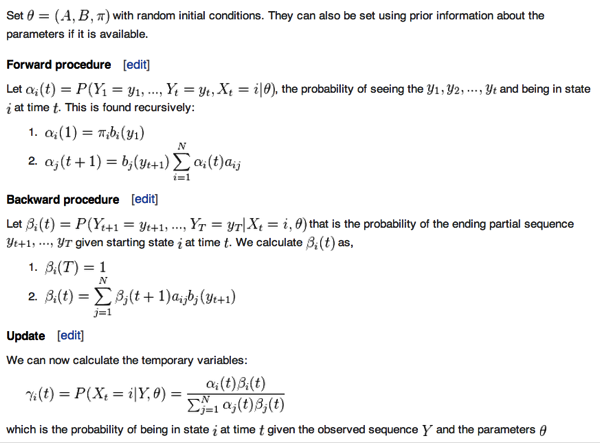
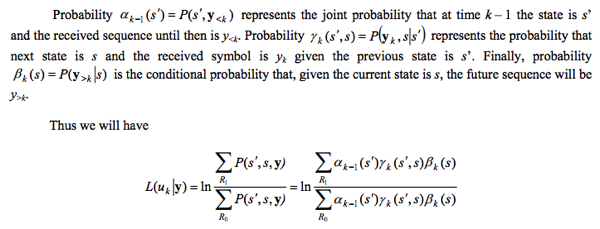
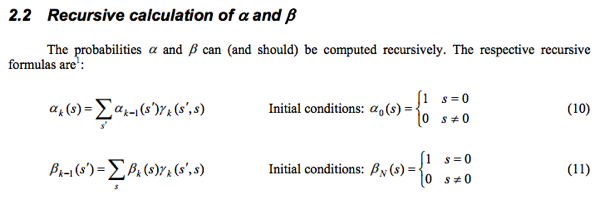
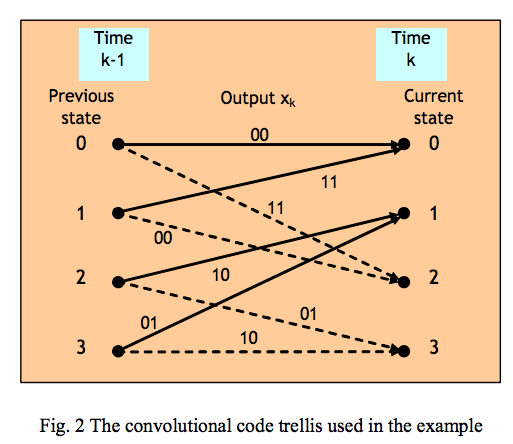
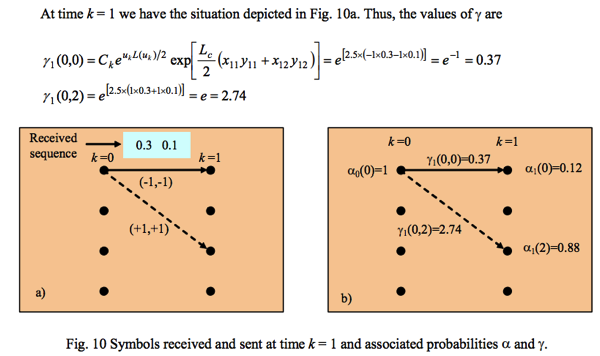
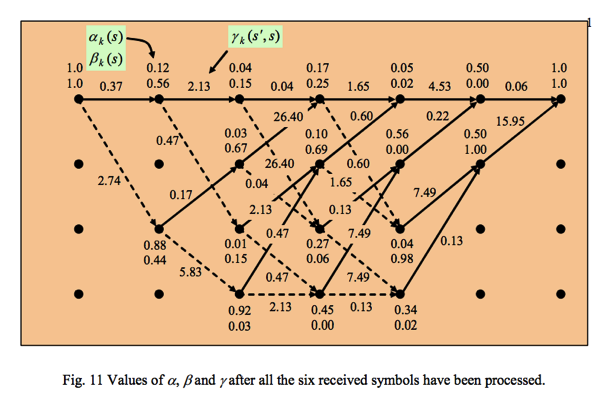
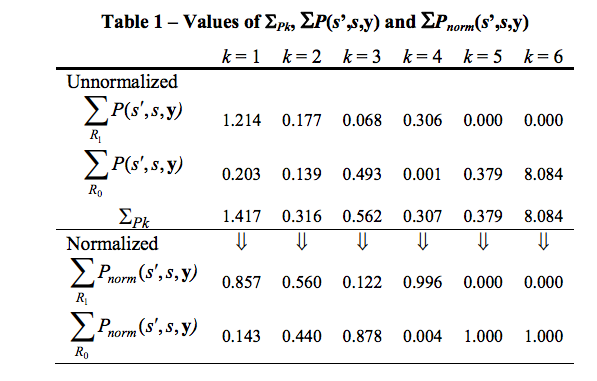
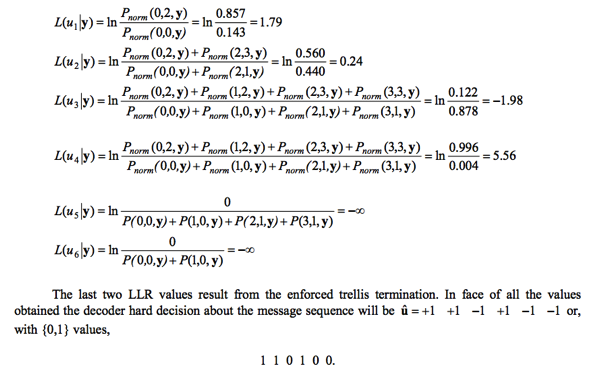
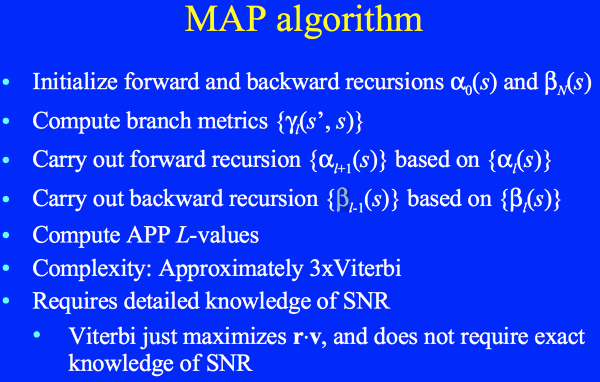
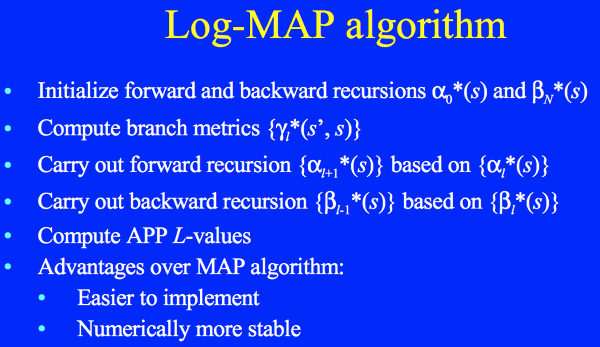
用 HMM 來類比 Kalman filter: alpha-beta (forward-backwar) algorithm 相當於 Kalman filter/smoother. Baum-Welch algorithm 相當於 EM algorithm. 另外還有 Viterbi algorithm for HMM sequential optimisation.
之後 study probabilistic graph model (PGM) 以及 factor graph. 如 Bishop 所言其實 Kalman filter 只是一個 PGM/FG 的簡單的應用。Kalman filter 放在 PGM framework 下是一個單純的 chain (special case of tree).
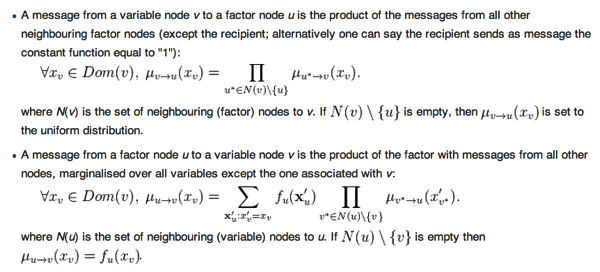
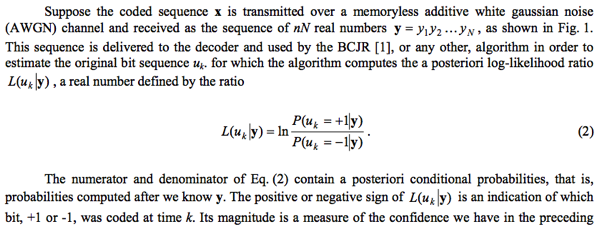
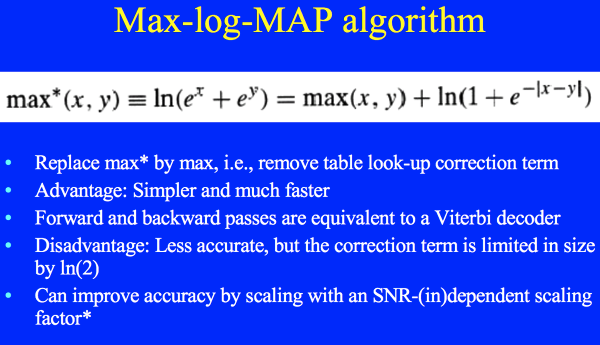
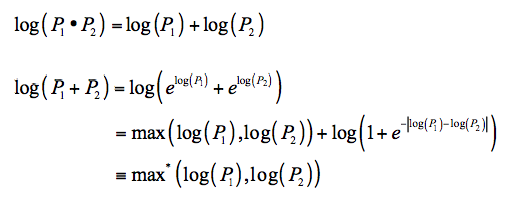
HMM 的 forward-backward algorithm 和 Viterbi algorithm 正好對應 PGM 中 message passing 的 sum-product 和 max-product algorithm. 同時在 Gaussian message 和 Gaussian factor (linear combination) 的情況下,sum-product algorithm 等價於 min-sum algorithm, 也就相等於 max-product algorithm.
PGM 可以把所有的 algorithm 都整合在同一 framework, 例如 EM algorithm, 例如 parameter estimation. 更重要的是 PGM 更 general 的 message passing algorithm 可以處理各種特別 model. 例如 switched state space model, 例如 time varying model, 例如 input control model, etc. Kalman filter 原來主要亮點是 recursive equation; 在 PGM message passing 只是最基本的 sum-product message passing 結果。
參考 Bishop video
先用一個非常簡單的例子來說明不同 graph 的優缺點。
Example 1: 在一個 noisy (zero mean with known variance w) 環境,estimate dc 訊號值。
Solution 1A: 直覺來說,最佳值就是所有 observables 的平均值,empirical mean: u = (x1+x2+ … + xn) / n.
如果 noise variance 是未知,最佳的 variance estimation 是 empirical variance: sum(xi – u)^2 / (n-1)
乍看之下不需要更複雜的 probabilistic graph model 或演算法。後面的例子會 show 這些 model 和算法的價值。
Solution 1B: 假設 noise 是 Gaussian distribution with zero mean. Maximum likelihood parameter estimation 對 likelihood function 微分,可以得到同樣結果。另一個假設是 xi 是 independence (i.i.d.).


Solution 1C (Plate model): 以下我們用不同的 approach, 就是 Bayesian approach, 基本上就是有 prior distribution. 我們用以下的 model: 假設 mean 是 Gaussian distribution p(u) with mean u and variance v. 我們最後的目標就是 estimate u (maybe w in some case?) 根據觀察到的 observables. Observables 包含 sensor noise (noise with zero mean and variance w) p(x|u) 同樣是 Gaussian distribution.
注意 noise variance w 和 mean 的 variance v 是兩個不同的概念。Frequentist 或 maximum likelihood lover 可能會困惑為什麼需要假設 mean 是一個 Gaussian distribution 而非一個 fixed parameter. Maximum likelihood 對於 parameter estimation 沒有 prior information 假設。
我們用以下的 factor graph 來 model: mean and observable 的關係。
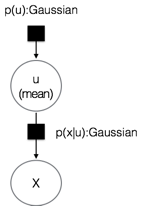
Include observables: it becomes joint Gaussian distribution. Given u, all xi are conditional independent.
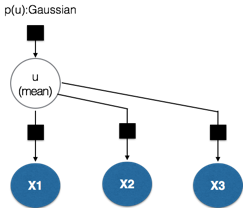
u 的 total message = product of incoming messages = exp((u-uo)^2/v] exp[(x1-u)^2/w] * exp[(x2-u)^2/w] * … * exp[(xn-u)^2/w)]
其實可以看到就是 u 的 marginal pdf: N(uo, v) * N(x1, w) * N(x2, w) * .. * N(xn, w)
mean = (uo * w + x1 * v + x2 * v + .. + xn * v) / (w + n * v) = (uo * w/v + x1 + x2 + … + xn) / (w/v + n)
variance = (v // (w/n)) = ( n/w + 1/v )^(-1)
uo and v 是 prior information (mean and variance) of u. 如果事先知道 u 的 distribution, v 很小: mean ~ uo
相反如果不知道 u 的 distribution, let uo=0 and v 很大: mean ~ (x1+x2+ ..+xn)/n 和 empirical mean 相同。
如果隨便選 uo 和 v, 當 n 夠大時,仍然會收歛到 empirical mean.
另外也可以從 conjugate prior 出發,得到相同的結果。
Conjugate prior 已經開始引入 sequence 的概念。新的 observables 會變為 prior information 的一部份。
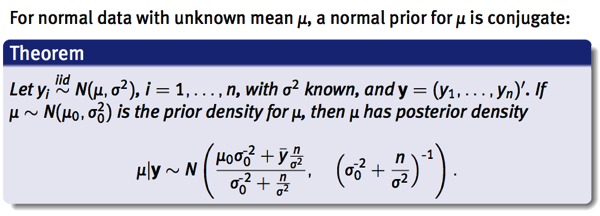
意即 Bayesian interpretation 多引入一個 prior distribution, N(uo, v), 的彈性。傳統的統計學,可能很難了解為什麼需要 prior information, 應該 “讓証據說話”
實務上 prior information 是一個有用的觀念,很多情況我們對要 estimate 的 parameter/distribution 有 prior information.
如果真的沒有 prior information, 就讓 prior distribution 的 variance 變大,代表 prior information 不清楚。
另外一個好處是在傳統的 machine learning, inferring 和 learning 是兩件不同的事。Learning 多半是 parameter estimation.
在 Bayesian interpretation 中,inferring 和 learning 都是 inferring.
Bayesian 還有其他好處嗎?
Solution 1D: 導入 Hidden Markov Model (HMM)
Prior distribution —> initial distribution of the estimated parameter
引入 recursive 觀念。新的 observables 持續 update inferring. 並導入 conjugate prior.
意即 prior information 可視為之前 observables 所得到的 information. 同一種 pdf family.
Or hidden markov model (HMM). HMM 是更 general 並且有用的 model.
(i) sequential observables, 可以建立 recursive equation.
(ii) 在 DC model 中, u(k+1) = u(k). 更 general case, u(k+1) = A u(k) 可以是 linear transformation (或加上 input signal).
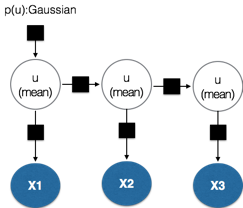
Forney factor graph 的表示方式: 灰字代表 unknown. 黑字代表 known or observables.
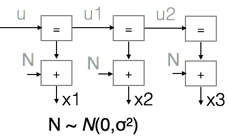
u 是 Gaussian distribution with mean uo and variance w. 這是 initial distribution 或是 prior information.
Based on 之前的公式:
u1 的 mean : (uo w + x1 v) / (v + w); variance = v w / (v + w) = v // w (v and w 並聯,小於 v and w)
u2 的 mean : mean(u1) w + x2 * v // w ) / (w + v // w ) = (uo w + x1 v + x2 v ) / (w + 2v); variance = v // w // w
…
結果和 Solution 1C 一致。比起 1C 的好處是 (i) recursive; (ii) 可以引入更 general 的 linear transformation chain model.
補充說明: Solution 1D 相當 forward message passing, 也就是 Kalman filter. 如果做 backward message passing.
再結合 forward and backward messages, 就得到 Kalman smoother. 以本例來說:
Backward: x2 的 mean and variance 回傳給 u1
u1_back mean = x2; variance = w
u1_forward mean = (uo w + x1 v) / (v+w); variance = v // w
Combine forward and backward message ==> equivalent to Kalman smoother
u1_total mean = [ x2 * v // w + (uo w + x1 v) / (v+w) * w ] / ( w + v // w) = (uo w + x1 v + x2 v) / (w + 2v)
u1_total variance = v // w // w
以上的結果和 u2 的 mean 和 variance 一樣。這也是我們預期。因為 P(u1 | x1, x2, u) = P(u2 | x1, x2, u).
再次強調 Kalman smoother 並不是 backward message. 而是 combine forward and backward message!!
結論是我們不用再記複雜的 Kalman filter or Kalman smoother 的 recursive equation! 只要 apply forward (and backward if we want to retrospect) message 的 sum-product (equivalent to max-product) rules!!
Example 2: 在一個 noisy (zero mean with unknown variance) 環境,estimate dc 訊號值以及 noise variance。
為什麼需要知道 noise variance? 在一些應用如通訊,估計 SNR (signal to noise ratio) 是非常重要且有用的參數。
Solution 2A and 2B 和 1A and 1B 一樣。用 empirical variance 或是 maximum likelihood 可以估計 noise variance.
從 PGM 或是 Bayesian approach, 也有兩種 model. 一種是 lumped 的 plate model, 另外是 HMM (不過我們稱 EM algorithm!)
Solution 2C (Plate model)
如下圖,意即除了 mean 的 prior information P(μ) 之外,還包括 variance (σ^2) 的 prior information. 比較方便是定義 precision λ = 1/σ^2. λ 的 pdf 是 P(λ).
P(μ) 假設為 Gaussian distribution with mean uo and variance v.
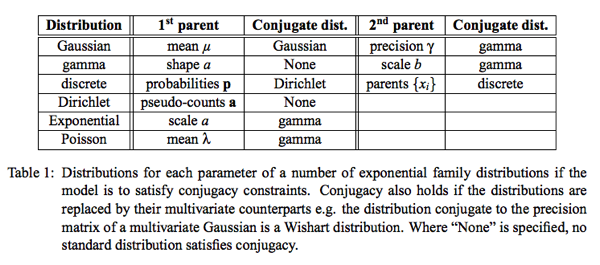
P(λ) 假設為 Gamma distribution, 因為 variance (1/precision) 只能為 positive number. Square of Gaussian distribution is Chi-squared distribution. Gamma distribution 是更 general distribution. Chi-squared distribution 是 Gamma distribution 的特例。Needless to say, Gamma distribution 仍是 exponential family.
Gamma(α, β) α 稱為 shape parameter, β 稱為 rate parameter

E(X or λ or Φ) = α/β; Var(X or λ or Φ) = α/β^2 這是 precision 的 pdf
Variance (σ^2) 的 distribution 稱為 Inverse Gamma distribution.
E(σ^2) = β / (α-1) ~ β/α Var(σ^2) = β^2 / (α-1)^2(α-2) ~ β^2/α^3
在 α >> 1 時, precision and variance 的 mean 基本上為倒數。但 variance 顯然不是。
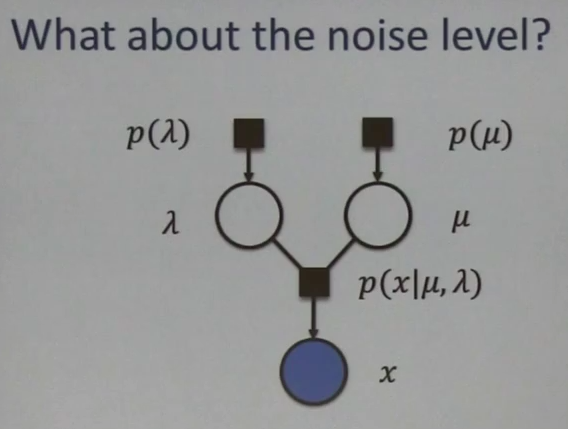
因此 factor graph 如上圖。Joint pdf P(μ, λ, x) = P(μ) * P(λ) * P(x|μ, λ)
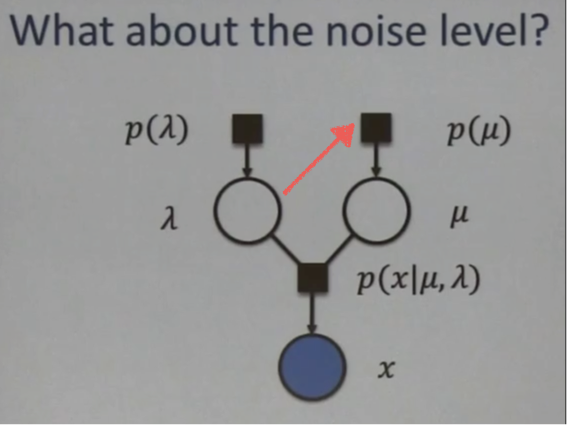
乍看之下,μ and λ 是完全 independent random variables. 不過這只有在 x 和 x 的 descendents 都是 unknowns 才如此。如果 x 或 x descendents 是 observables, μ and λ 就變為 dependent. 這可由 Bayesian directed graph explaining away 解釋。
Joint pdf P(μ, λ, x) = P(μ) * P(λ) * P(x|μ, λ)
P(μ, λ) = P(μ) * P(λ) (是 independent)
P(μ, λ|x) ≠ P(μ|x) * P(λ|x) (Given x, μ and λ 變為 dependent)
以上的 model 需要四個 parameters fully characterized, 分別是 μ 的 mean and variance; λ 的 mean and variance. 不過會有一個問題是無法得出一個 general conjugate prior, why? 因為 real data 的 mean and variance 是 dependent? 如果用 independent mean and variance 來 model prior information 會有問題?
應該是 conjugate prior 有問題,但仍可以用以上的 model for message passing?
另一種 model 的出發點是既然 P(μ) 是一個 Gaussian distribution. 同時 P(x|μ, λ) 也是 Gaussian distribution with mean μ. 就讓 P(μ) 儘量接近 P(x|μ,λ). σ2 和 λ 剛好是倒數。所以 σ2 是 inverse-Gamma distribution.
另一種 model 是讓 μ and λ 有如下的 dependency. 同樣有四個 parameters, μo and no (for μ), νo, and σo (for σ). 這是 conjugate prior 的做法。
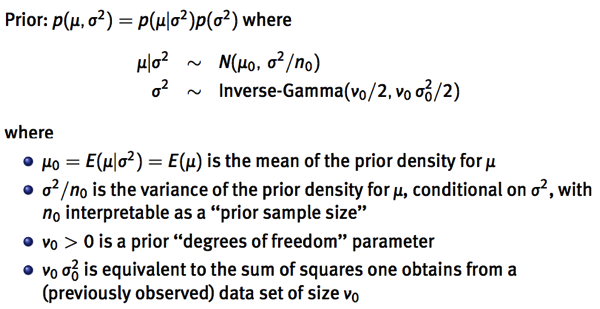
no 是 prior sample size 還蠻有 physical insight! 代表 prior information 相當於 no 個 observables.
這 no observables 的 mean 是 μo, variance 是 σ2. 不過 σ2 pdf 又引入另一個 νo (degrees of freedom) 以乎和 no 有重覆。
假設 no 和 νo 一致,那就簡化到三個參數: μo (prior mean), σo^2 (prior variance), (no,νo) (prior sample size). 換言之讓 u, σ dependent, 可以簡化到三個參數,但 dependency 會讓 message passing 更複雜。
另一篇 paper 更清楚, 同時加上了 n observations. 最後的 prior (p(μ,Φ))+ posterior (p(Y)) joint pdf 如下。就 graph model 而言,就是 plate model.

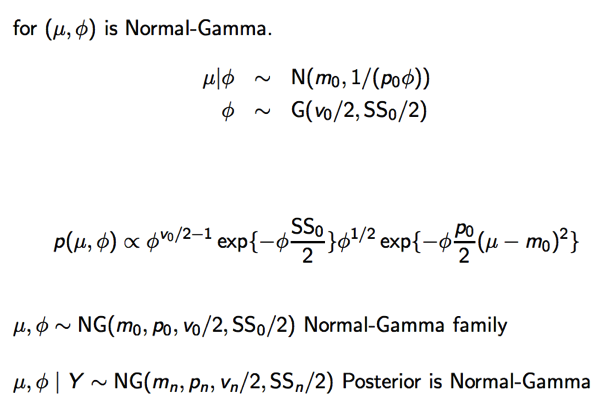
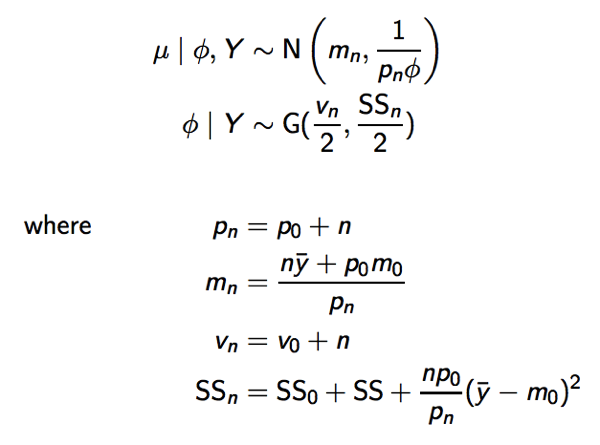

當 samples 愈大 (n):
Normal pdf 逼近 delta function 收歛到 empirical mean (y_bar).
Gamma pdf 的兩個參數: shape (α) and rate (β). 當 samples 愈大 (n), shape 愈大,rate 愈大(scale 愈小)。Gamma pdf 會逼近 delta function (可用 python or matlab function plot). Φ (precision) 會收歛到 Gamma function 的 mean = α/β = νn/SSn —> 1 / (empirical variance)
所以 Inverse Gamma pdf 的 mean 收歛到 (SSn/νn) ~ SSo/n + SS/n + po/pn ( y_bar – mo)^2 ~ SS/n 意即 empirical variance!
Gamma pdf 的 variance 收歛到 SS/n^2 ~ 0 意即最後變為 delta function.
上述公式的詮釋
po 相當於 prior information 等價於 po 個 samples
mn 是 prior information 和 observables 平均的結果
νn degrees of freedom, 應該和 po 有相同的功效
SSn 包含 3 個部份:
SSo: prior information of variation
SS: observables 的 variation (sum of squares)
最後一項是: prior mean 和 sample mean 的 variation
Solution 2D 導入 Hidden Markov Model (HMM)
上節 (Solution 1D) 從 plate 到 chain 提供更 general 的 model. (a) recursive equation; (b) linear transformation.
下圖的 μ 為 x(k), Φ 為 Σ(k), x 為 y(k)
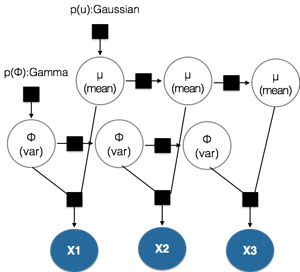
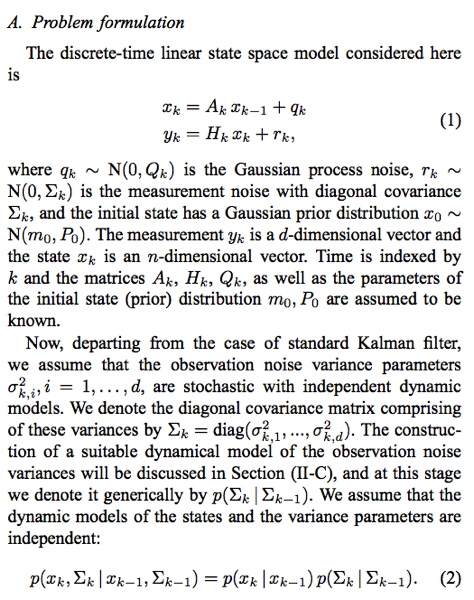
其實上圖就是 Kalman filter 的推廣。以下為更 general Kalman filter 的 problem statement.
Estimate DC signal with unknown variance, 只是 A=1, Q=0, H=1 的 special case!
我們主要先考慮 VB inference 因為可以把 noise variance 和 observations 連結一起。
目標是計算 posterior distribution:
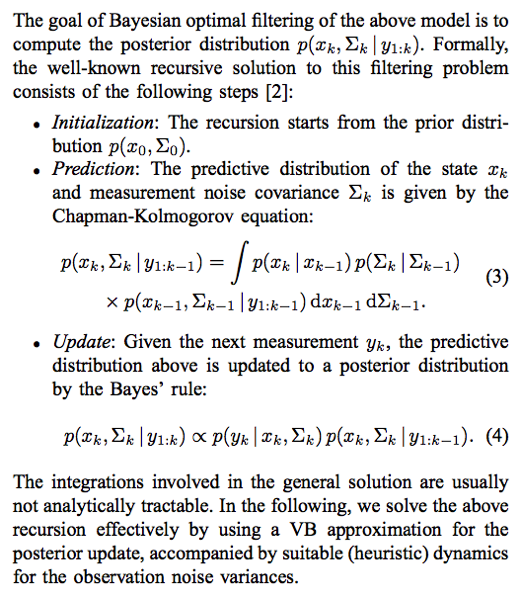
Initialisation and prediction 基本上都和 Kalman filter 一致。困難的是 eq. (3) 的 integration.
密訣是假設 mean 是 normal pdf; variance 是 Gamma distribution 同時 mean and variance 是 independent.
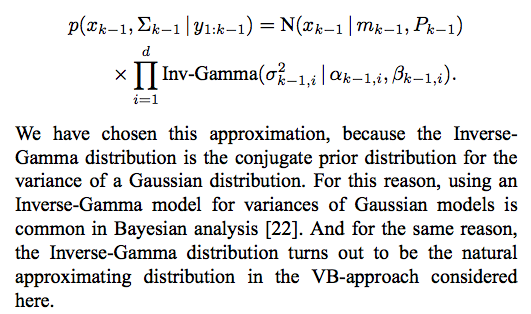
By Bayesian directed graph rule, 上述的 conditional mean and variance 非 independent.
我們仍用這樣的近似。


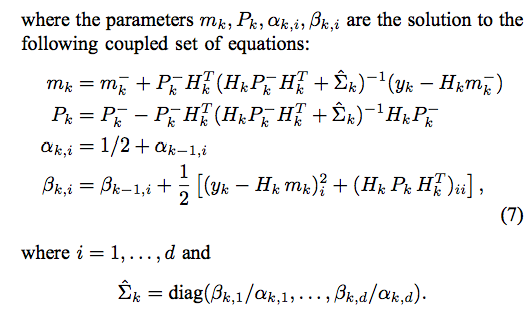
注意以上的 equations 是聯立方程式 (mk, Pk, Σk are unknowns 但有三個 equations to solve).
為了避免解聯立方程式,我們再把每個 update phase 做 N 次 iteration 來解如下。
Predict phase 和之前 equation 相同,不過引入了 noise 的 heuristic dynamic parmeter ρ. 在 time varying noise 時 ρ 的角色很重要,更詳細的說明請見後文。
Update phase 就是用 fixed N iteration 來解上述 equation (7).
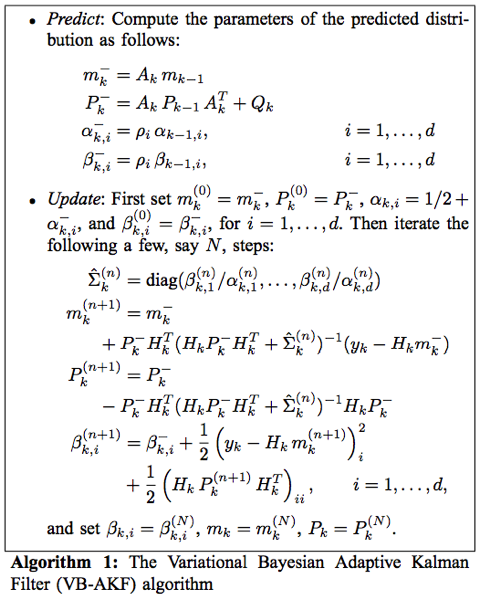
ρ = 1 : stationary noise variance. ρ < 1 表示 precision Φ (1/σ^2) 的 variance 增加。
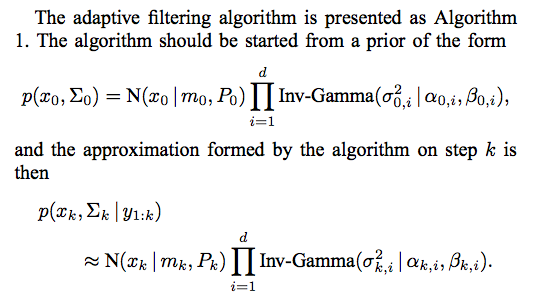
可以看到引入 HMM 比 plate model 更 general. (1) 是 recursive method 而非 batch method (需要等到所有的 measurements). Recursive method 非常適合 real time processing. (2) 更 general 可以加上 process noise (Q > 0), dynamic model (A != 1). 以下是 simulation results.
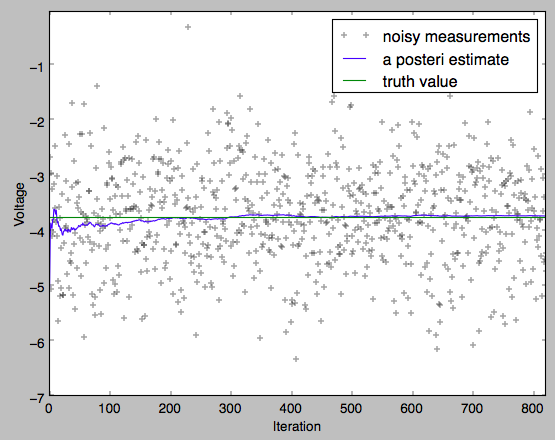
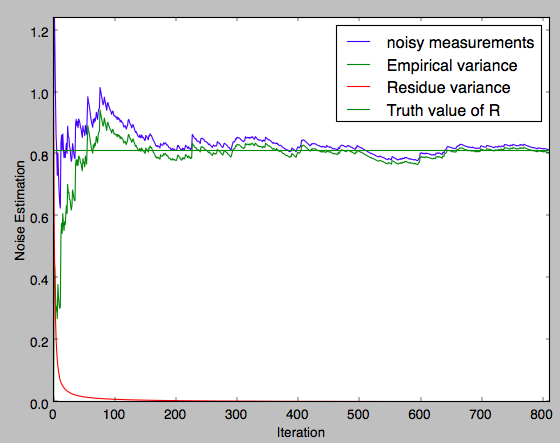
Q=0 or R >> Q (mean=-3.8; Q=1e-5; R=0.81)
下圖是 mean 的 true value (state), measurements, estimation. 和普通 Kalman filter 不同的是 noise variance R is unknown. 是由 equation (7) estimate.
下圖是 noise variance R 的 variance 以及 break down to empirical variance and P (residue variance).
前文解釋過: 開始時 K 接近 1, estimate mean 接近 measurement, empirical variance 非常小。
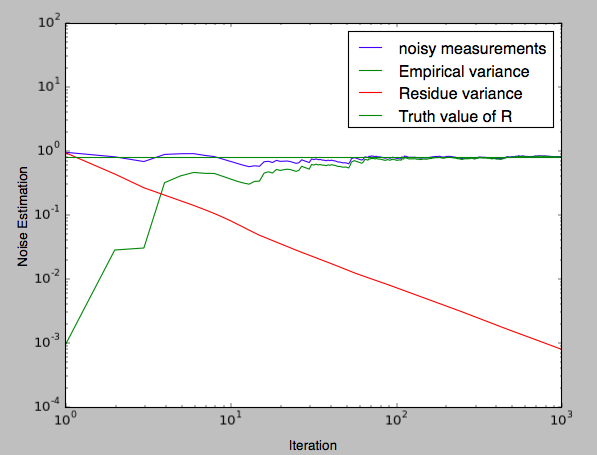
residue variance (P) ~ R/n. 這由 log plot 可以看出。
隨著 estimate mean 接近 true mean, K 接近 0, empirical variance dominate. Residue variance -> 0.
Log scale.
更 general case 請參考 Adaptive Kalman filter. 包含 time varying noise and time varying signal.
本文主要強調使用 PGM 的威力。可以處理更複雜的問題。只要能用 PGM model, 就可 inference model 中的 parameters. How to explain EM algorithm?
